Dashboard reports vs report automation: when to use which
An opinionated take on dashboard reports vs report automation — what each is actually for, where each fails, and why most companies need both.
Dashboard reports and automated reports answer different questions. A dashboard is an interactive surface behind a login for people who explore: analysts, ops teams, real-time decisions. An automated report is a fixed, branded artefact delivered to people who receive: executives, clients, boards, auditors. Most mature teams need both, fed from the same data; the mistake is asking one to do the other’s job.
Two teams ship the same numbers every month. The first builds a Looker dashboard, links it in Slack, and tells stakeholders to “check the dashboard.” The second runs an automated pipeline that drops a branded PDF in the executive’s inbox at 8am on the first Monday. Same data, same business. Different things happen on the receiving end.
The first dashboard gets opened twice in the first week and never again. The second PDF gets read every month, forwarded to the board, and quoted back in the next leadership meeting. The data hadn’t changed. The delivery had.
That’s the argument this piece makes — and it’s the argument I’d make to any team that thinks the dashboards-versus-reports question is settled. It isn’t. Dashboard reports and automated reports solve different problems for different audiences, and most mature operations need both. For the architectural background, the report automation walks through the components.
What a dashboard actually is
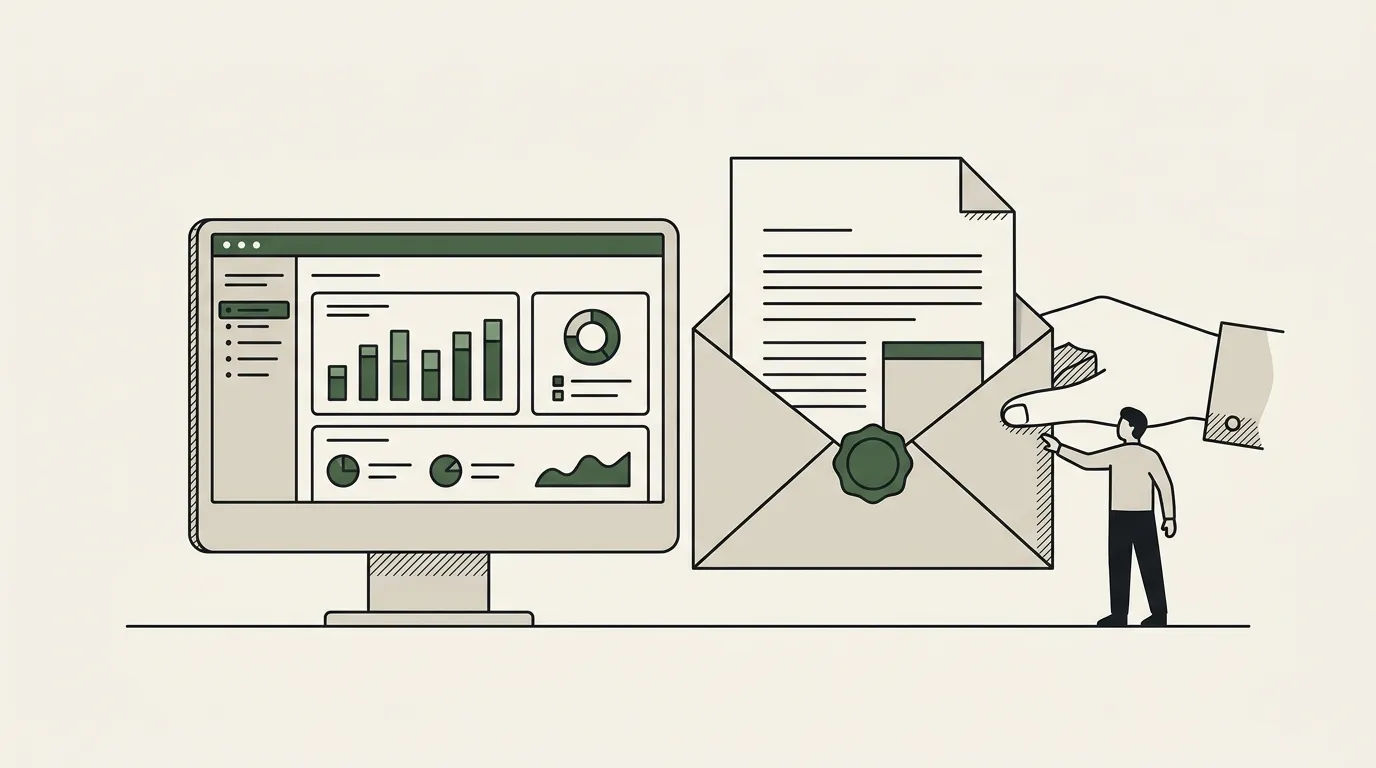
A dashboard is an interactive surface. It lives behind a login. The user goes to it, picks a date range, filters by segment, drills into the chart they care about, exports the row that surprised them. The audience comes to the data. The dashboard’s job is to let them ask the next question.
This is a real, valuable workflow. It’s how analysts work. It’s how an ops lead figures out why the funnel converted differently this week. It’s how a CS director sees which accounts are at risk. The dashboard rewards curiosity. It serves the user who has the time and the appetite to explore.
The tools — Looker, Tableau, Metabase, Power BI, the BI inside your data warehouse — are very good at this. Filters work. Drill-throughs work. Cross-filtering works. The chart library is rich. If your problem is “I need analysts to explore the data,” you have your answer, and the answer is a dashboard.
What a report actually is
A report is a self-contained artefact. A PDF, a slide deck, a Word document. It has a fixed structure. It tells a story in a specific order. The audience receives it — by email, by portal, by Slack drop — and reads it without ever logging into a tool. They might forward it. They might print it. They might paste a slide into a board pack. The artefact travels.
The report’s job is the opposite of the dashboard’s. The dashboard says “here is the data, ask it questions.” The report says “here is the answer, in the order someone has decided you should hear it.” That choice — the imposed order, the curated narrative, the locked-down structure — is the value. It’s what makes the report read in two minutes by someone who isn’t going to filter anything.
Both have a place. Most teams confuse the two and ship the wrong one for the wrong audience.
Where dashboards win
Three places a dashboard is the right answer, full stop.
| A dashboard wins when | Because |
|---|---|
| The user is exploring: finding something they do not know yet | Filters and drill-throughs; by the time a report answers the question, the question has moved |
| The decision is downstream of “what is happening right now” | Trading floors, ad-spend pacing, on-call boards; a report cannot catch up |
| The audience is technical or operational | Engineers, analysts, ops and growth teams want the live tool open in a tab |
If your problem fits any of those three, you don’t need an automated report — you need a better dashboard. Don’t over-engineer.
Where report automation wins
Five places where a dashboard quietly fails and a report quietly carries the load.
| A report wins when | Because |
|---|---|
| The audience is executives, boards, investors, partners | They open an email and read for two minutes; if nobody logs in, the dashboard’s answer does not exist |
| The deliverable ships on a cadence to the same people | Monthly client reports, QBRs, weekly scorecards, board packs: the report is the cadence |
| A regulator or auditor wants the artefact | A versioned, signed, dated PDF; a dashboard’s data shifts between viewing and review |
| The output has to look like the brand | A BI PDF export gets 60% of the way; the typography, cover and white label are the other 40% |
| It must look identical run to run | Dashboards drift as chart libraries and default filters change; a template does not |
This is the gap dashboard reports — meaning a dashboard exported as a PDF — try to fill and don’t. The export is a fine snapshot. It’s a poor branded artefact. The tool’s chrome leaks through. The colour palette doesn’t quite match. The export is twelve pages when the executive wanted three. For internal use, fine. For anything that leaves the company, not fine.
The honest case for dashboard reports
I’ll give the steelman. Plenty of teams ship dashboard reports — scheduled snapshot exports — and they work. They work when the audience is internal, when the brand expectations are loose, when the dashboard layout was designed with a portrait page in mind, when the BI tool’s PDF rendering is good enough.
If your case fits all four of those, ship the dashboard report. Don’t build a pipeline. The piece I’d add: review the export quarterly with someone outside the data team. Either it still passes the bar or you’ve outgrown it. If you find yourself screenshotting the dashboard report and pasting slides into a deck before sending — that’s the signal. The report use case has arrived. Stop fighting it.
Why most companies need both
Most operations of any maturity end up running both. The dashboard serves the people who explore. The report serves the people who receive. The trick is knowing which audience you’re serving and not trying to make one tool do both jobs badly.
A working pattern: the dashboard is the source of truth for the team that owns the data. The report is the consumption layer for everyone downstream. The dashboard updates continuously. The report ships on a cadence. The dashboard answers “why?” The report answers “what?”
Same data layer feeds both. The dashboard is built in your BI tool. The report is generated by a report automation tool that walks a designed template and fills it from the same data source. The two layers don’t compete; they cover different sides of the same workflow.
How to decide for a specific use case
Walk it through these four questions and the answer falls out.
| Question | Dashboard | Report |
|---|---|---|
| Who is the audience? | They log in voluntarily | They do not |
| What decision do they make? | Exploratory: drill, filter, discover | Fixed, on a cadence: review, sign off, file |
| Does the brand have to show up? | No | Yes; no amount of theming fixes a dashboard’s limits |
| Must it look identical every cycle? | No; dashboards are tools and evolve | Yes; reports are artefacts |
Four-for-four on dashboard, build the dashboard. Four-for-four on report, build the report pipeline. Mixed answers — and most are mixed — usually mean you need both, with the dashboard serving the makers and the report serving the consumers.
A pattern that works
The pattern I see in mature data operations: the dashboard is built once and lives in the BI tool. The automated report is built once and ships on a schedule to the audiences who don’t open the BI tool. They share a data layer. Neither is rebuilt by hand each cycle.
The mistake that costs teams quarters: assuming the dashboard will eventually replace the need for the report. It won’t. The audience that needs the report will keep asking for it, and someone will keep hand-building it, until the team accepts that the report is a real artefact and automates it properly. The audiences are different. The workflows are different. The deliverables should be too.
For the longer architectural treatment of report automation, see the report automation. For the dashboards-versus-documents version of this question framed for marketing teams specifically, see marketing dashboard vs document. For the practical “how do I actually build the report pipeline” walkthrough, see automate reports.
Common questions, answered
What's the actual difference between dashboard reports and a report? +
If I already have dashboards, do I still need report automation? +
Aren't dashboard reports — exported as PDF — basically the same as automated reports? +
Which one is cheaper to maintain over a year? +
Where do dashboards quietly fail? +
Related reading
- Report Automation → Guide
- Agency Client Reporting Automation → Guide
- Document Automation → Guide
- Marketing dashboard vs marketing document: when to send which → Blog post
- How to automate reports: a practical guide for 2026 → Blog post
- Report automation tools: a buyer's framework for 2026 → Blog post