
What a QBR is and why CS teams over-spend on them
A Quarterly Business Review is the structured conversation between a Customer Success team and a key account, anchored on a deck or report that summarises the quarter. The deck is rarely the point of the meeting; the conversation is. The deck is the artefact that makes the conversation possible.
The cost shows up in the prep work. Each QBR is a small data-gathering project: pull product usage from the analytics platform, pull support tickets from the helpdesk, pull commercial metrics from the CRM, write the narrative, format the deck, run an internal review, send it to the customer ahead of the meeting. At a scale of 20 accounts per CSM, that’s roughly two days of prep per CSM per quarter. At 100 accounts, it’s a full work week before each cycle.
QBR automation is the practice of removing the prep work from the human and leaving the conversation. The CSM still drives the meeting, still owns the relationship, still adds the per-account commentary that makes the QBR worth showing up to. The deck just stops being something the CSM has to assemble from raw inputs every quarter.
Accounts · CRM via REST API
Template: Google Slides or Docs
{{account.name}}
Quarterly business review
{{account.arr}} ARR
{{account.health}} health
{{usage.highlights}}
one deck per account, fresh data each quarter
Generated output
SlidesPDFGlobex
Quarterly business review
$240,000 ARR
Green health
Adoption up in 3 of 4 teams this quarter.
A working QBR template
A healthy QBR template fits in eight to twelve slides, in roughly this order. Build the template once and you have the structure that an automation layer can fill.
| # | Slide | What it holds | Filled by |
|---|---|---|---|
| 1 | Title | Account name, quarter, CSM, customer team | Data |
| 2 | Executive summary | One paragraph: the hardest slide to automate well, the easiest to write badly | The CSM |
| 3 | Adoption metrics | Active users, key feature adoption, usage milestones the customer cares about | Data |
| 4 | Outcomes against goals | What the customer set out to achieve, and where they are now | Data, with the goals as fields |
| 5 | Support and stability | Ticket volume, time to resolution, incidents that mattered | Data |
| 6 | Commercial summary | ARR, contract status, expansion, renewal; often permission-gated | Data |
| 7 | Roadmap and what’s next | Relevant roadmap items and the customer’s next-quarter priorities | Data plus the CSM’s selection |
| 8 | Asks and risks | What the CSM needs from the customer; the risks being tracked | The CSM, never automated |
The slides above are roughly 70% data-driven and 30% narrative. The data-driven slides are the ones automation handles cleanly; the narrative slides are where the CSM adds value the system can’t.
The five elements of a great QBR
What separates a QBR worth showing up to from a QBR that erodes the relationship:
- It’s anchored on the customer’s goals, not the vendor’s roadmap. The metrics on slide three should be the metrics the customer told you they cared about, not the metrics your product team optimises.
- It’s data-driven where it matters and narrative where it counts. Adoption and outcomes deserve numbers. Asks, risks, and the executive summary deserve a human voice.
- It treats the executive summary as the single most important slide. Most QBRs lose the room because the first slide after the title is a wall of charts. The first content slide should be a paragraph the customer’s executive sponsor reads in fifteen seconds and walks away with the takeaway.
- It surfaces risk honestly. A QBR that hides churn risk is a QBR that delays the conversation, not avoids it. Strong CS teams use the QBR to surface risk while there’s still time to mitigate.
- It ends with a clear ask. “Here’s what we need from you” beats “thank you for your time” every time.
Automation makes the first three easier (consistent metrics, consistent structure, room for narrative) and stays out of the way of the last two (the human is the human).
When CS teams should make the jump
The signals that you’ve outgrown a manual QBR workflow:
- CSMs spend more than four hours per account on QBR prep
- Accounts per CSM is above 50, or growing
- There is already a template, and the template alone has not fixed the cost
- The CS leader cannot say in two minutes which metrics every QBR contains, because every CSM does it slightly differently
- A CS platform (Gainsight, ChurnZero, Catalyst) already holds most of the data, and deck assembly is still manual
Three or more ticked: automation pays back in the first two cycles.
If three or more are true, automation pays back in the first two cycles. The cost case is straightforward and we walk through it on the report automation cost section; QBRs are an instance of the broader recurring-report pattern, the same one behind automated investor reporting.
How QBR automation works
QBR automation is a clean instance of the four-component model from the document automation guide. Specifically:
Data layer
Per-account data assembled from your CS platform (Gainsight / ChurnZero / Catalyst), your product analytics (Mixpanel, Amplitude, Heap, Segment), your CRM (Salesforce, HubSpot), your helpdesk (Zendesk, Intercom) and your billing system (Stripe, Recurly, your finance system). The data layer is where most QBR automation projects spend the setup time, because each tool has its own way of representing what should be the same metric.
Template
The eight-to-twelve-slide deck described above, authored in Slides or PowerPoint by your design team or your VP of CS. Brand-consistent. Designer-edited. The template is editable in the original tool throughout the engagement.
Generation engine
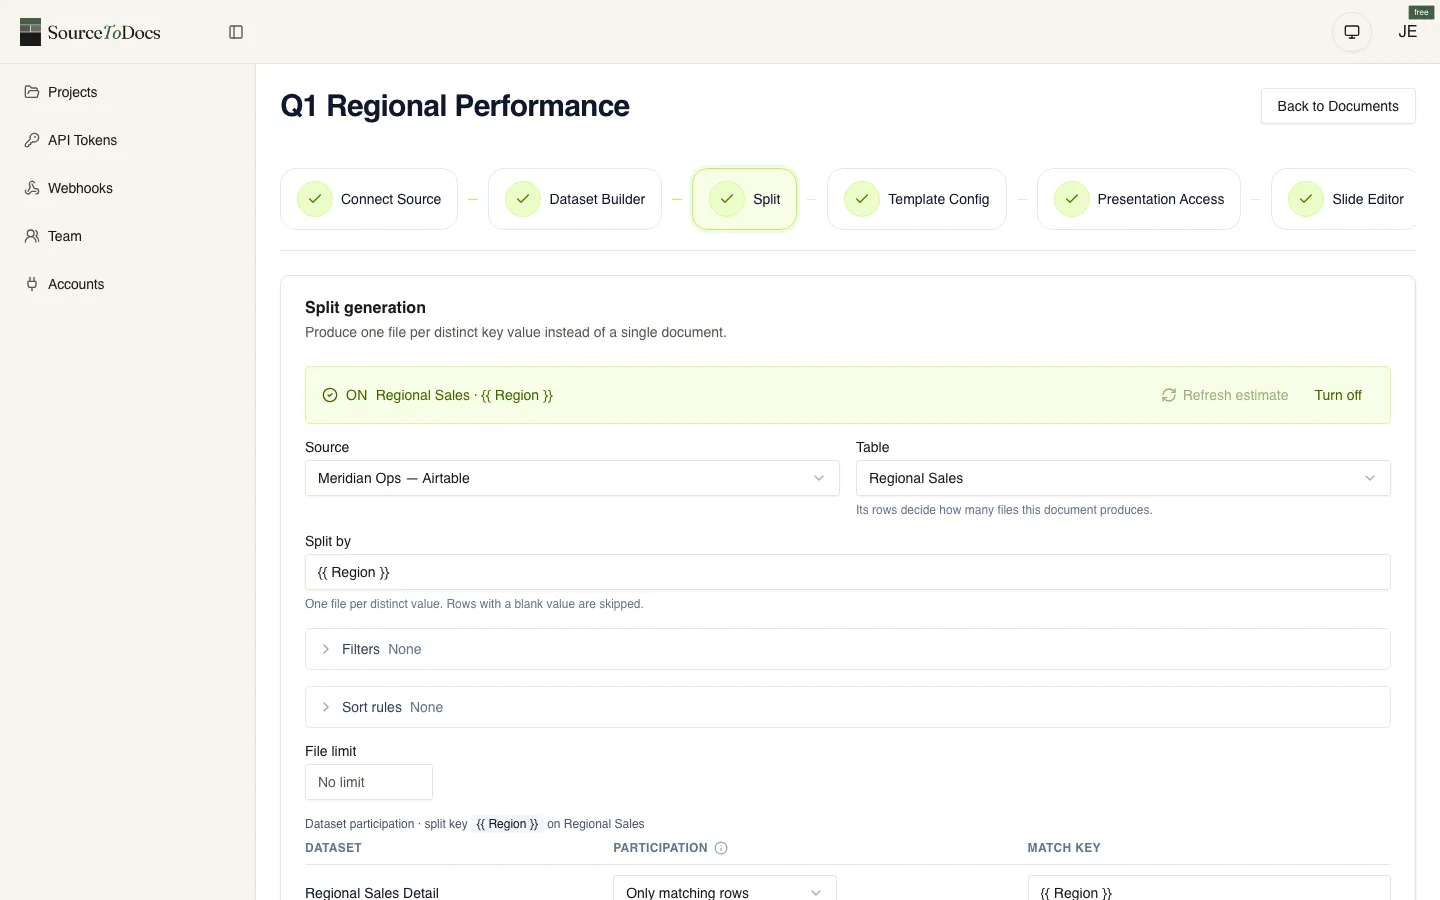
Per-account, the generation engine binds account-specific data to the template, expands repeating sections (one row per goal, one card per top issue), applies conditional logic (“hide the incidents slide if there were no incidents this quarter”), and emits a finished deck. The narrative slides have placeholders the CSM fills before the meeting.
Orchestration
Generation runs on schedule (a week before the QBR window opens) or on demand. Outputs route to a drive folder, get attached to the account record in your CS platform, and notify the CSM that the draft is ready for narrative editing. The CSM spends the saved time on the conversation prep instead of the deck prep.
Integrating with Gainsight, ChurnZero, Catalyst, HubSpot
The CS platform is one of several data sources, not the destination. The integration is read-only: pull the metrics that matter for the QBR, render them into the template, attach the finished deck back to the account record for traceability.
The platforms differ in what they expose. Gainsight has a robust API and is the easiest to integrate; the per-account scorecard data is usually directly bindable. ChurnZero and Catalyst expose similar shapes via their APIs. HubSpot’s CRM data is bindable but sometimes needs intermediate normalisation to match what your CS team treats as canonical.
The honest scoping question for any CS-platform integration: does the metric we want in the QBR live in the platform with a stable name, or does the team currently compute it in a spreadsheet? Metrics that live in the platform are easy. Metrics that live in someone’s spreadsheet need to either move into the platform or get computed inside the data layer of the automation system.
QBR software: what it is and how to choose
“QBR software” is a search people run when the template has stopped scaling and they want a category to buy from. There is no single category; there are three, and the choice is about where the QBR’s value actually lives.
| Category | Tools | Right when | Weak when |
|---|---|---|---|
| Customer success platforms | Gainsight, ChurnZero, Catalyst, HubSpot service tools | The QBR is an internal artefact for the CSM and the health, usage and renewal data already live there | The customer expects a branded, designed deck |
| Deck generation tools | A designer’s Google Slides master filled one deck per account from the CRM, product database and CS platform | The QBR is customer-facing, has to look like your brand made it, and repeats sections per product or region | There is no designed template to start from |
| BI and dashboard tools | Looker, Tableau and their kin refreshing charts into a deck | The QBR is mostly charts | It is narrative and layout, which is most of them |
How to choose, in order: can it generate one deck per account from your data rather than one deck by hand; does the template stay exactly as designed across a hundred accounts; can it repeat sections for each product or region without a separate template; does it connect to the systems the data lives in (CRM, CS platform, warehouse); and is pricing per workspace rather than per CSM seat, so adding the team does not add to the bill. The five elements of a great QBR above are the checklist for the content; these five are the checklist for the tool.
SourceToDocs for QBRs
SourceToDocs runs as a template-driven QBR automation platform that connects to the data sources CS teams already run on. Templates are authored in Slides or PowerPoint by your design team. The generation engine handles per-account binding, conditional logic and repeating sections; the orchestration layer schedules and routes outputs.
The narrative layer — executive summaries and per-account commentary — can be assisted by AI where you want it: we draft, the CSM edits. We discuss this hybrid pattern on the AI report generator page. SourceToDocs is a SaaS document automation platform with a free plan and self-serve tiers from $19/mo billed annually (Starter, Pro, Agency, Scale) plus Enterprise. REST API and n8n/Make/Zapier automation from the Pro plan up. See pricing for the full breakdown.