
Why client reporting is a different problem from BI dashboards
Most agencies start their reporting story with a dashboard tool: Whatagraph, AgencyAnalytics, Klipfolio, Looker Studio, or a custom Power BI workspace. Each one ranges from “good” to “great” at exposing data inside a UI the client can log into. None of them solve the actual deliverable problem.
Automated client reporting is upstream of dashboards. The deliverable agencies actually owe their clients — the thing the account director walks the CMO through, the thing that lands in the procurement team’s inbox at month-end — is a branded report. A PDF, a Slides deck, sometimes a multi-page Word document. Dashboards are infrastructure; reports are the artefact.
This page is the agency-specific instance of the broader report automation playbook; the customer-success instance, for teams that need to automate QBR reporting, has its own page. Most of the four-component architecture and the build-vs-buy logic from that page apply here too; this page focuses on the things that are different about agency-shaped problems.
Accounts · Airtable + ad platform APIs
Template: Google Slides or Docs
{{client.name}}
Monthly performance report
{{metrics.spend}} spend
{{metrics.leads}} leads
{{summary.narrative}}
one deck per client, white-labelled to their brand
Generated output
SlidesPDFAcme Co
Monthly performance report
$12,400 spend
87 leads
Lead volume up 22% on last month.
The five things every agency client report needs
Across roughly fifty agency reporting engagements (ours and the ones we hear about from prospects), the same five requirements show up in the brief every time. Any tool that drops one of them eventually gets replaced.
| Requirement | What it actually means | Where tools drop it |
|---|---|---|
| Brand consistency | The report looks like the agency’s work every time: right fonts, unstretched logo, one palette | Dashboard exports; the single biggest reason agencies leave them |
| White-labelling | Some clients need the report to look like theirs: agency name gone, client logo and colours on every page | Tools built around one workspace identity |
| Recurring delivery | Monthly or weekly per client, without an account manager pressing a button | Anything that needs a person per run |
| Client-specific data | Each report is one client’s ad accounts, CRM and analytics, kept apart from the next client’s | Flat connectors with no per-client scoping |
| Executive summary | One paragraph up front saying what mattered this month and why | Tools that treat narrative as a text box bolted on at the end |
Tools that hit four of five tend to hit a ceiling at roughly thirty clients. Tools that hit five of five scale to hundreds.
The reporting tools landscape
Two layers, often confused. Worth keeping them separate when you’re scoping.
| Dashboard layer | Document layer | |
|---|---|---|
| Tools | Whatagraph, AgencyAnalytics, Klipfolio, Looker Studio, Power BI | SourceToDocs, plus mail merge, Apps Script and bespoke builds |
| Built for | Live exploration; clients who log in | The deliverable: a branded file the client receives |
| Where brand breaks | The export | It doesn’t; the master is the brand |
| Who it serves | The team | The client |
| Scales to | Any number of dashboards | Hundreds of clients from one master |
The dashboard layer
Whatagraph, AgencyAnalytics, Klipfolio, Looker Studio, Power BI. Connect ad platforms and analytics, build dashboards, share with clients. Some of these have document-export features that approximate reporting; the export is usually where brand consistency breaks. The category is excellent for live exploration and for clients who actually log in. It’s a poor fit for the deliverable.
The document layer
Tools that produce branded files from data: SourceToDocs, plus a long tail of mail-merge, Apps Script, and bespoke-build approaches. The category is smaller because the architectural commitment is harder — you have to get template preservation right while also letting the data layer be flexible. Most agencies that scale past forty clients end up running a dashboard layer plus a document layer in parallel.
The hybrid stack we see most often is Looker Studio (or BI tool of choice) for the live data exploration, plus a document automation platform for the branded recurring deliverables. The same data sources feed both. The dashboard is for the team; the document is for the client.
The white-label requirement
White-labelling is the single requirement that most generic reporting tools handle poorly. The reason is architectural: most dashboard tools are designed around a single workspace identity, and “make this report look like it came from the client” requires either per-workspace branding (expensive in seat licences) or template variants (which most tools don’t expose).
The clean architectural answer for white-labelling is to separate three things: the data layer (per-client), the master template (per-brand — agency’s, or client’s, or both), and the orchestration layer (per-engagement). Once those are separated, white-labelling becomes a configuration choice, not a redesign. The same data layer can produce an agency-branded executive review and a client-branded board pack from the same monthly run.
This is the mental model that platforms designed for document automation follow natively. It’s why agencies often discover they want a document automation platform rather than another dashboard tool, even if they originally searched for the latter.
How automation works for agencies
The shape of an automated client reporting setup, for an agency running between 20 and 200 clients, looks roughly like this.
- 01
Data sources, normalised
Each client's data lands in one intermediate layer: an Airtable workspace, a warehouse or a structured sheet. Ad platforms, analytics, CRM and the agency's own time tracking are reconciled there, so naming, time zones, currency and schema drift are handled once.
- 02
Master templates, branded
One master per brand variant. Most agencies start with two, their own and a neutral one they rebrand per client, and add named-client variants for the highest-stakes reports.
- 03
Per-client configuration
Which template, which sections, which channels, which language, which executive-summary tone. Account managers edit it without engineering.
- 04
Generation and routing
Reports run on the second business day of the month, or on demand, one per client. Outputs land in a Drive folder with a PDF alongside; the run log records which client got which version.
- 05
The narrative layer
AI drafts the executive summary and channel commentary from the data, an account manager edits for taste and accuracy. A two-hour job per client becomes fifteen minutes; see the AI report generator guide.
Build vs buy for agencies
The build-vs-buy framework from document automation applies, with two agency-specific tilts.
Build tilts in your favour if reporting is a part of how you differentiate (boutique data agencies, performance-marketing shops where reporting is part of the product). It also tilts in your favour if you have unusual data residency or compliance requirements that rule out third-party services.
Buy tilts in your favour if reporting is operationally important but not commercially differentiating — the most common case — and if you’d rather staff account managers, strategists, and creatives rather than report-system maintainers. The buy option also lets you scale headcount on the work that’s actually billable, which most agencies under-prioritise.
The third option, which is what platforms like SourceToDocs solve, is buy a SaaS platform with the four-component model already built and configure it to your agency’s specifics: a Meta Ads connector tuned for your reporting taxonomy, a custom executive-summary writer trained on your house style, a per-client white-label configuration UI for your account managers.
Client reporting automation tools: what to look for
Once you have decided the deliverable is a document rather than a dashboard, the tool choice comes down to five capabilities. Evaluate every candidate against them in this order, because the first two eliminate most of the market.
| Capability | The test | Fails if |
|---|---|---|
| Per-client generation from one master | One template, a hundred clients, a hundred reports in one run | It needs a template per client, or a person per report |
| White-label at the client level | Logo, palette and sender switch per client from data | Someone edits a settings screen before each run |
| The data sources you really have | Ad platforms and analytics by API, the numbers in Sheets or Airtable, a warehouse for larger agencies | It reads one spreadsheet and pushes integration back onto you monthly |
| Template fidelity in the format clients keep | The hundredth Slides deck or PDF looks like the first | A longer number moves a chart the designer placed |
| Scheduling and delivery inside your workflow | Monthly on a date or when the data lands, filed and sent automatically, ideally over an API | The finished file still needs a human to send it |
The client reporting tools comparison applies these to the five tools agencies most often shortlist, and the buyer’s guide covers the pricing models.
SourceToDocs for agencies
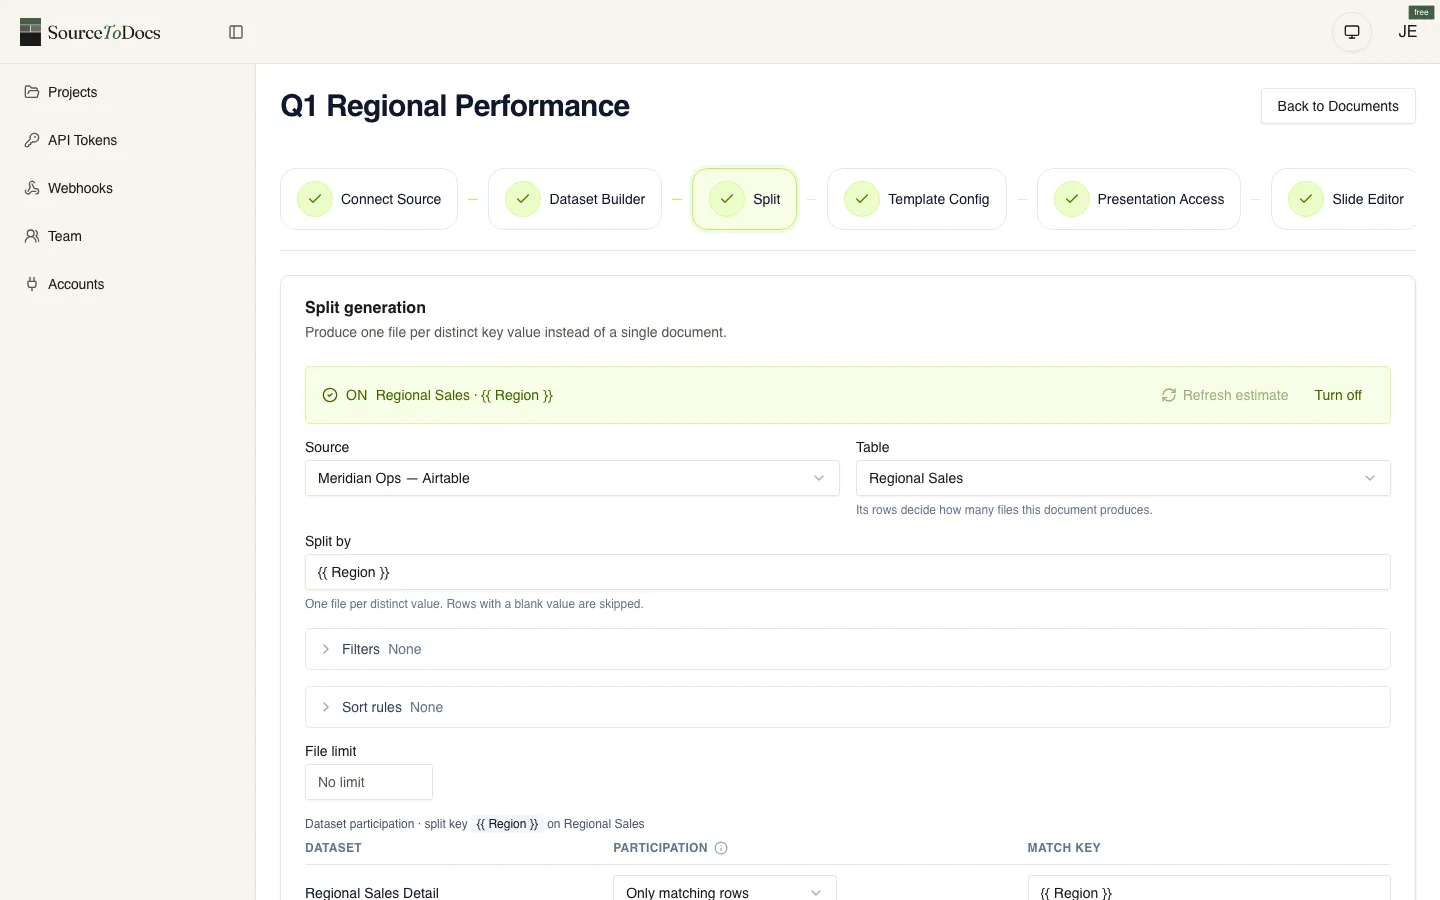
SourceToDocs runs as a template-driven document automation platform with a configuration layer agencies can run themselves. Data connects through the five sources SourceToDocs supports — Airtable, Google Sheets, SQL databases, CSV upload, and a REST API that works with n8n, Make, Zapier, or anything that speaks HTTP — so the ad platforms, analytics and CRMs your reporting taxonomy already uses can feed in through those. Templates are authored in Slides, PowerPoint, Word, or HTML by your designers. The orchestration layer schedules runs, routes outputs, and maintains the audit trail you’ll want when a client asks why a number changed.
If you’re evaluating proposal-flow tools for client deliverables, see PandaDoc alternatives — proposal platforms and recurring-report platforms solve different problems, and most agencies need the second.
SourceToDocs is a SaaS document automation platform with a free plan and self-serve tiers from $19/mo billed annually (Starter, Pro, Agency, Scale) plus Enterprise. REST API and n8n/Make/Zapier automation from the Pro plan up. See pricing for the full breakdown.