Agency client report template
A white-label monthly performance report, generated one per client account from your campaign data.
Free plan, no credit card. Bring your own design or start from this layout.
What’s in this template
Every block is bound to a field in your data. The layout stays exactly as designed; only the values change from one run to the next.
- Cover with the client's logo and reporting period {{client.name}} · {{period}}
- Headline metrics row {{metrics.spend}} · {{metrics.leads}}
- Channel performance table loop: {{channels}}
- Chart block bound to the period data {{charts.trend}}
- Written summary and recommendations {{summary.narrative}}
- Next-month plan {{plan.actions}}
How this template fills itself
Connect Airtable, Google Sheets, a SQL database, a CSV or a REST API, map each field to a placeholder, and generate. One run can produce a single document or one per matching record.
Accounts · Airtable + ad platform APIs
Template: Google Slides or Docs
{{client.name}}
Monthly performance report
{{metrics.spend}} spend
{{metrics.leads}} leads
{{summary.narrative}}
one report per client, in that client's brand
Generated output
SlidesPDFAcme Co
Monthly performance report
$12,400 spend
87 leads
Lead volume up 22% on last month.
Who uses this template
Marketing agencies
Produce a branded report for every account on the same cycle without an account manager rebuilding each one.
Read the guideFreelancers and consultants
Send a report that looks like a studio made it, from the data you already collect for the work.
Read the guideIn-house marketing teams
Report to stakeholders monthly in a fixed format that makes periods comparable at a glance.
Read the guideThe monthly client report is the document agencies rebuild most often and enjoy least. The work is real but repetitive: pull the numbers, drop them into last month’s deck, rewrite the commentary, fix what the paste broke, export, send. Multiply by every account.
What changes when you generate it
The template stops being a file people copy and becomes a layout the data fills. The design is owned by whoever built it in Google Slides; the numbers come from the platforms; the narrative stays yours, written once per client in a field next to the data. A run produces every client’s report at once, and a correction is made in the data and regenerated rather than fixed in twelve separate files.
Related templates
All reports →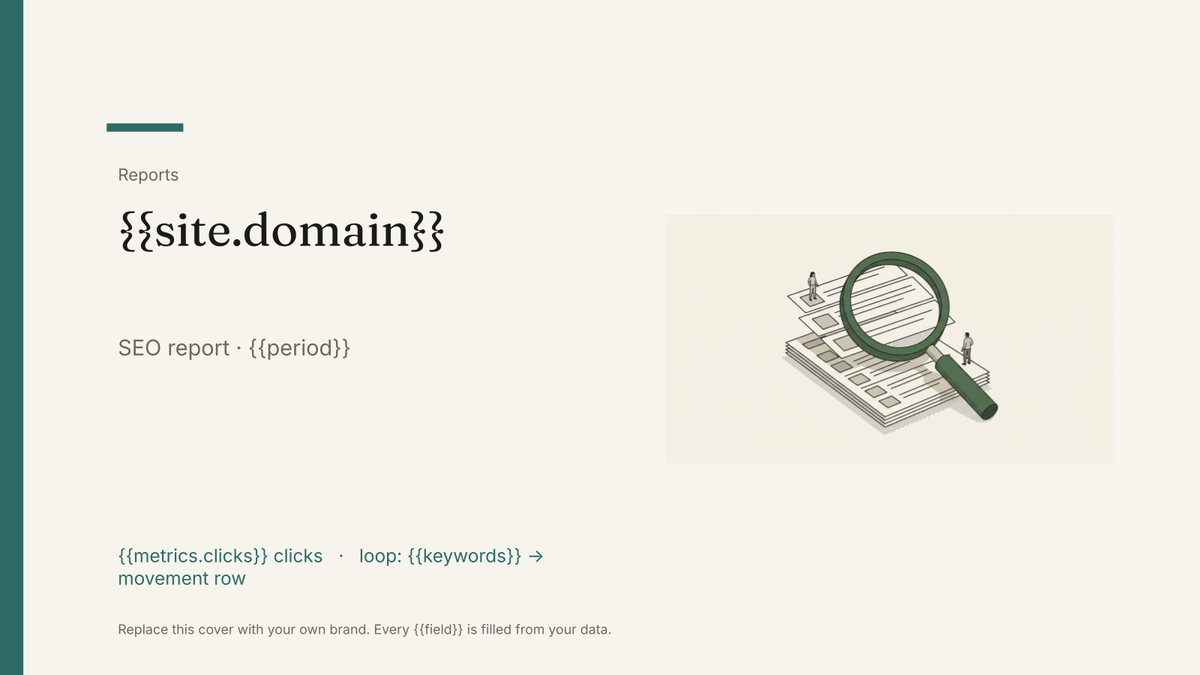 Google Slides
 SEO report template
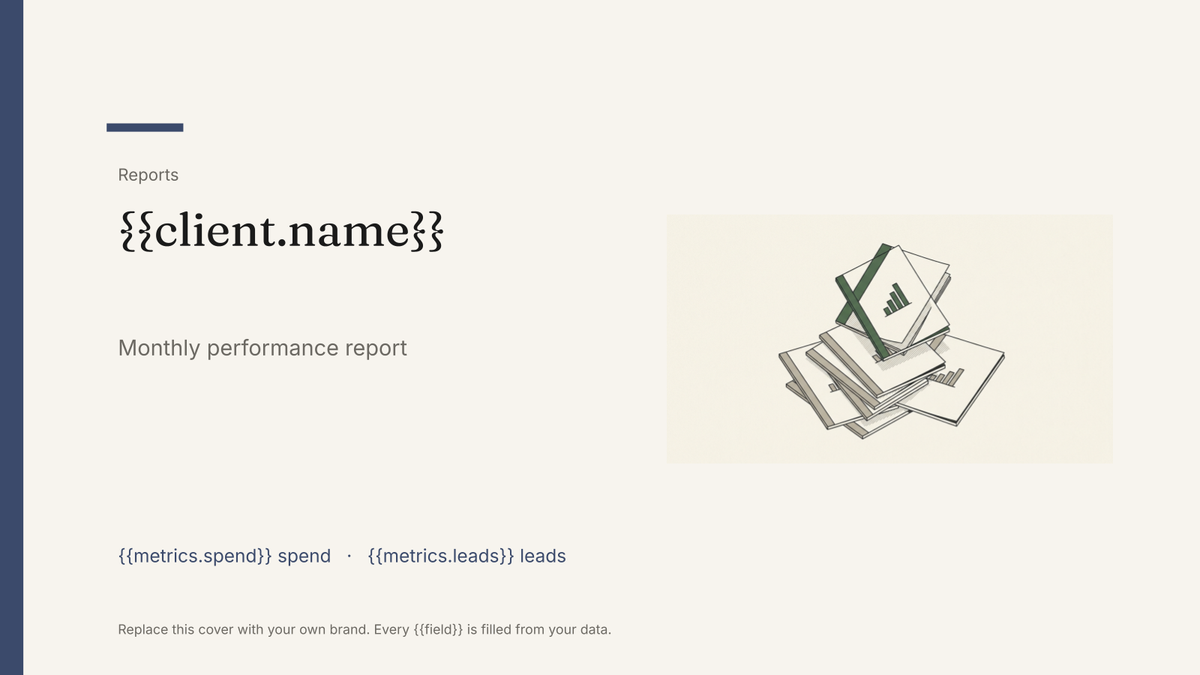
A monthly search performance report with ranking, traffic and technical blocks, generated one per site from your SEO data.
View template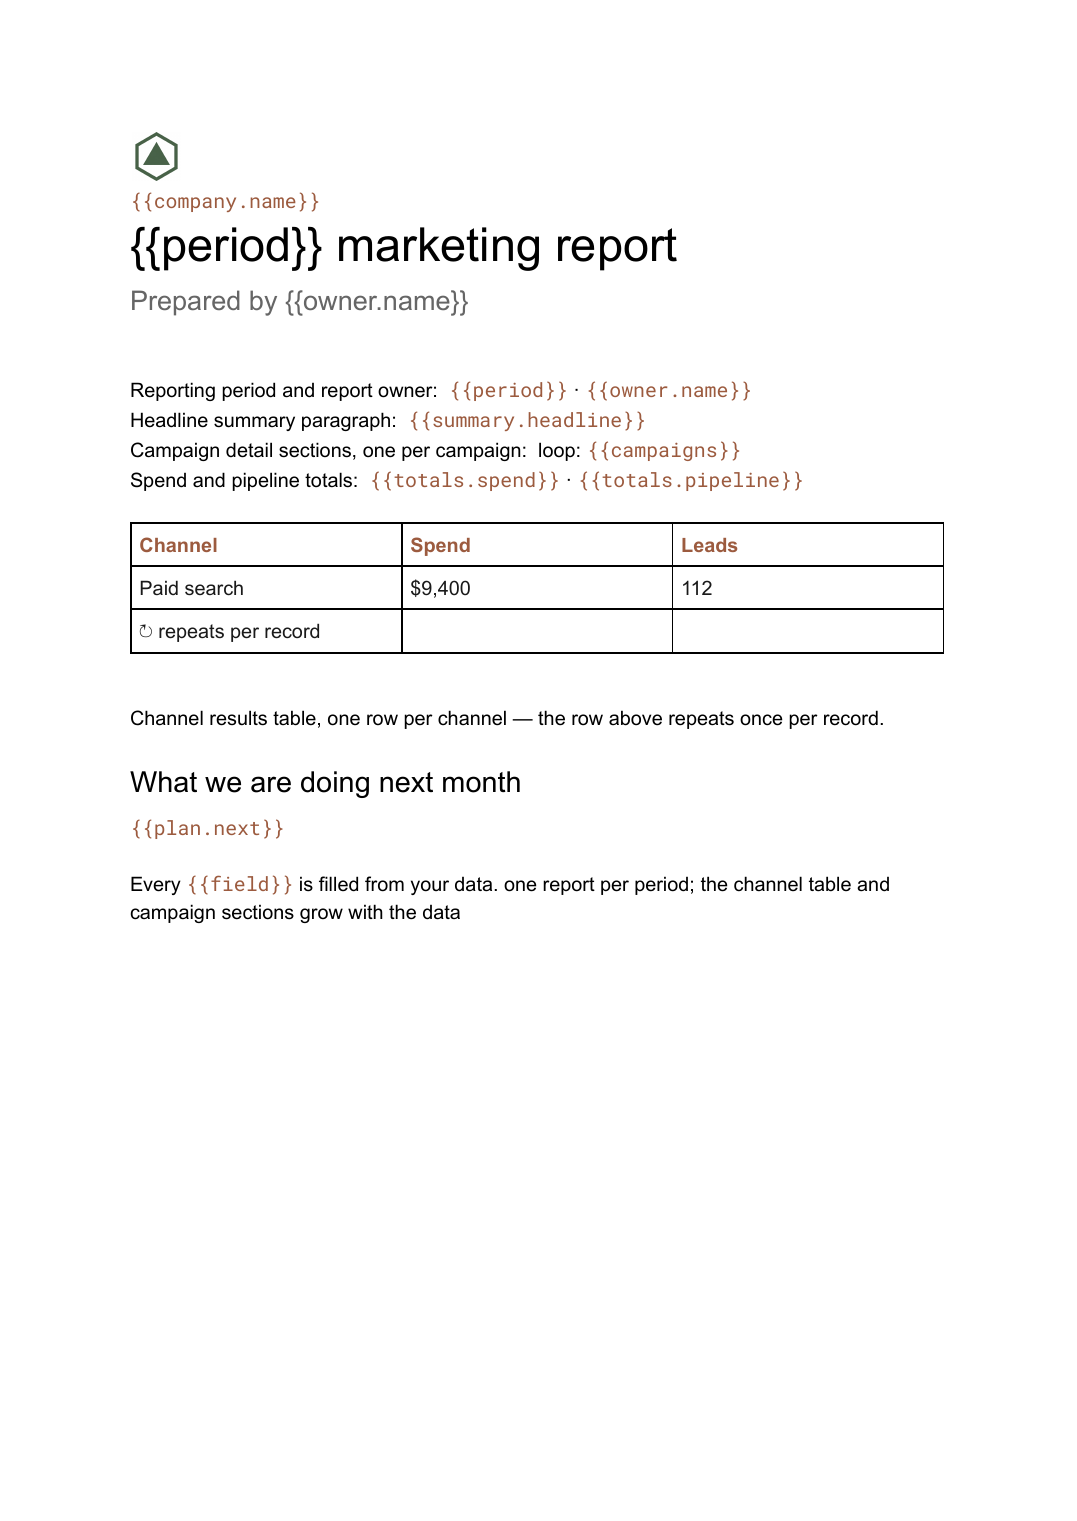 Google Docs
 Monthly marketing report template
A month-by-month marketing performance write-up with channel tables and campaign sections, generated per period from your campaign data.
View template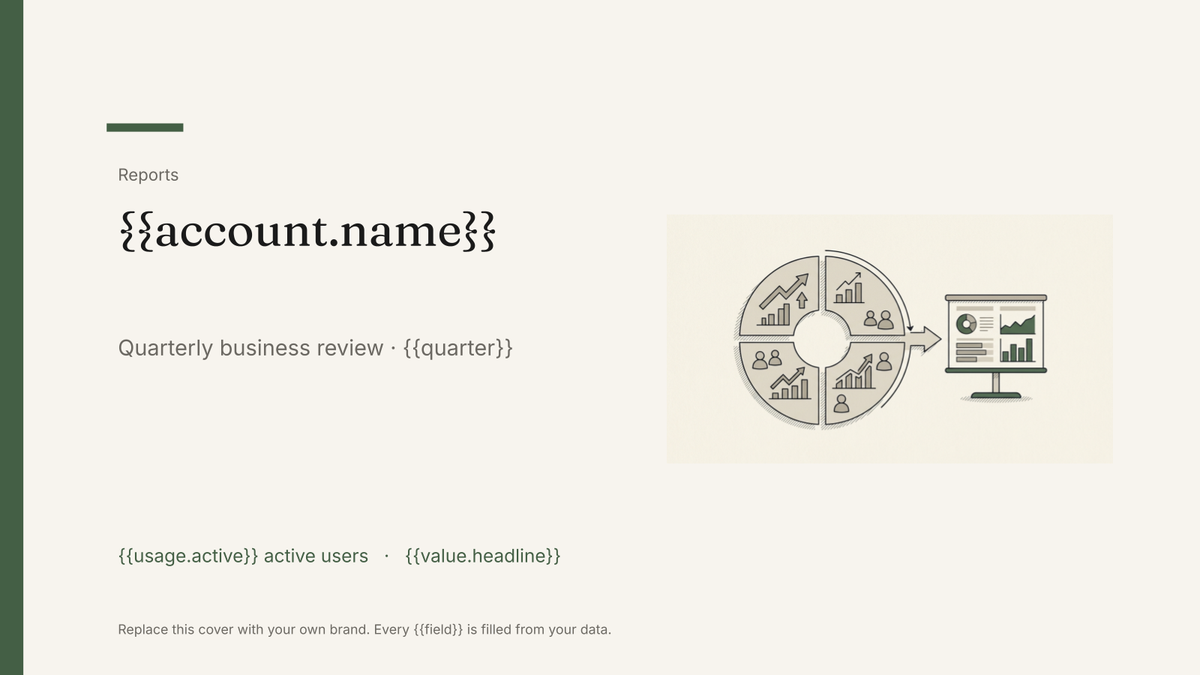 Google Slides
 QBR deck template
A quarterly business review deck covering value delivered, adoption and next-quarter plans, generated one per account from your customer data.
View template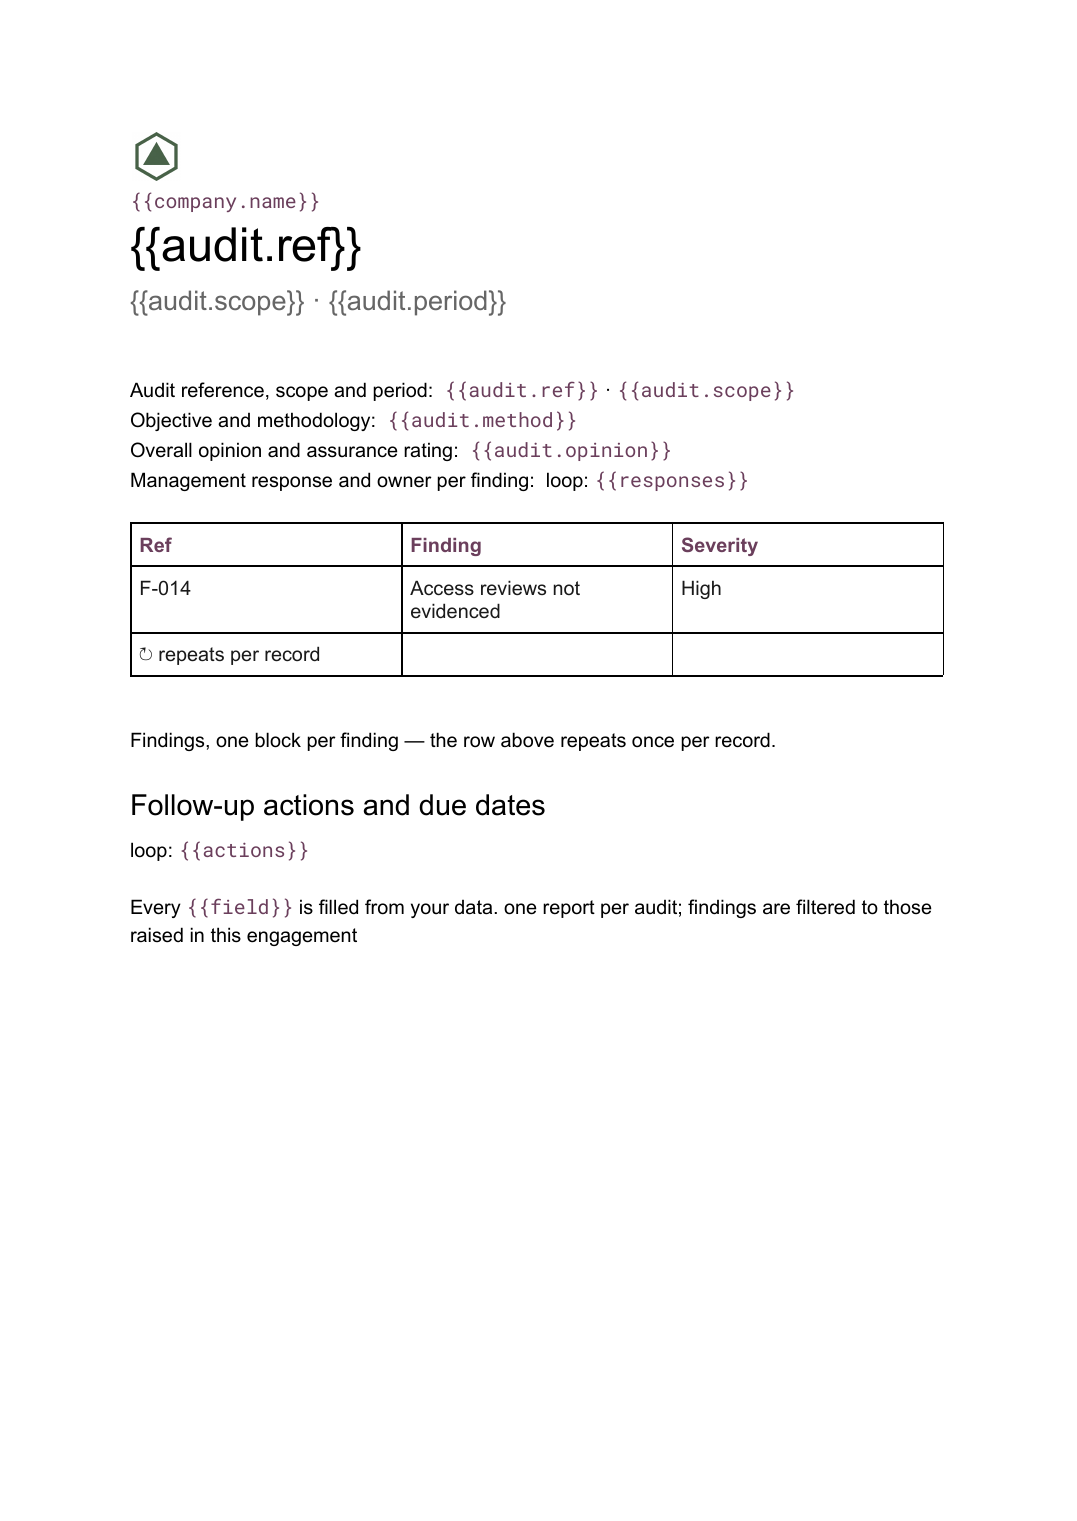 Google Docs
 Audit report template
A per-audit report setting out scope, findings with severity and management responses, generated from your findings register.
View templateCommon questions, answered
Can the report be white-labelled per client? +
Why Slides rather than a document? +
Where do the numbers come from? +
Can I generate every client's report in one run? +
Generate this document from your data
Start on the free plan, connect a data source, and export a real Google Slides document. No watermark, no credit card.