Airtable to Google Slides: the complete walkthrough (with templates)
Build the Airtable to Google Slides pipeline end to end: the base schema that makes it work, the field-to-placeholder map, ready-made deck templates, and the four failures that break it.
To generate Google Slides from Airtable, mark up one deck with placeholders, map each Airtable field to a placeholder once, and run: every matching record becomes its own deck, with linked records expanding into repeating slides. This walkthrough covers the base schema that makes it work, the field mapping, ready-made templates, and the four things that break it.
An ops engineer at an agency built the Airtable-to-Slides pipeline three times. The first version was a Saturday-afternoon Apps Script that worked beautifully for a month, then started corrupting the brand template every time the designer renamed a layer. The second was a Zapier flow, reliable until volume crossed about forty decks a day, when rate limits and per-task pricing began to bite. The third was a dedicated platform, and the third stuck.
This piece is the third version, written out in full. Not a survey of the options, which the Airtable document automation guide covers properly, but the actual build: the base schema that makes it work, the mapping between Airtable fields and template placeholders, and the four things that reliably break it.
Start from the record that becomes one deck
Almost every failed Airtable-to-Slides build starts in the wrong place, with the template. Start with a sentence instead: one row of this table becomes one deck.
For an agency reporting on client accounts, that sentence names the Accounts table. For a conference, the Events table, not the Sessions table. For a sales team, the Opportunities table. Get this wrong and everything downstream fights you, because the generator produces one document per row of whatever table you point it at.
A base shaped for generation usually looks like this:
| Table | Role | Key fields |
|---|---|---|
| Accounts | One row becomes one deck | Name, Quarter, Owner, Health, Logo |
| Metrics | Linked to Accounts, one row per metric | Account (link), Label, Value, Change |
| Projects | Linked to Accounts, one row per project | Account (link), Title, Status, Due |
The Accounts row supplies everything that appears once on the deck. The linked tables supply everything that repeats. That division is the entire mental model, and it maps exactly onto how a Slides template is built: fixed elements on the cover, a repeating slide for the linked records.
Map fields to placeholders once
The template is a normal Google Slides deck. Wherever a value should land, the designer types a placeholder in the text: {{account.name}}, {{quarter}}, {{metrics.total}}. They are ordinary text, so a designer can style them, move them, and see exactly where the data will sit.
Mapping is then a table of correspondences you set once:
| Airtable field | Placeholder | Appears |
|---|---|---|
| Accounts → Name | {{account.name}} | Cover title, every slide footer |
| Accounts → Quarter | {{quarter}} | Cover subtitle |
| Accounts → Health | {{account.health}} | Status block |
| Metrics (link) | loop: {{metrics}} | One row per metric in the summary table |
| Projects (link) | loop: {{projects}} | One slide per project |
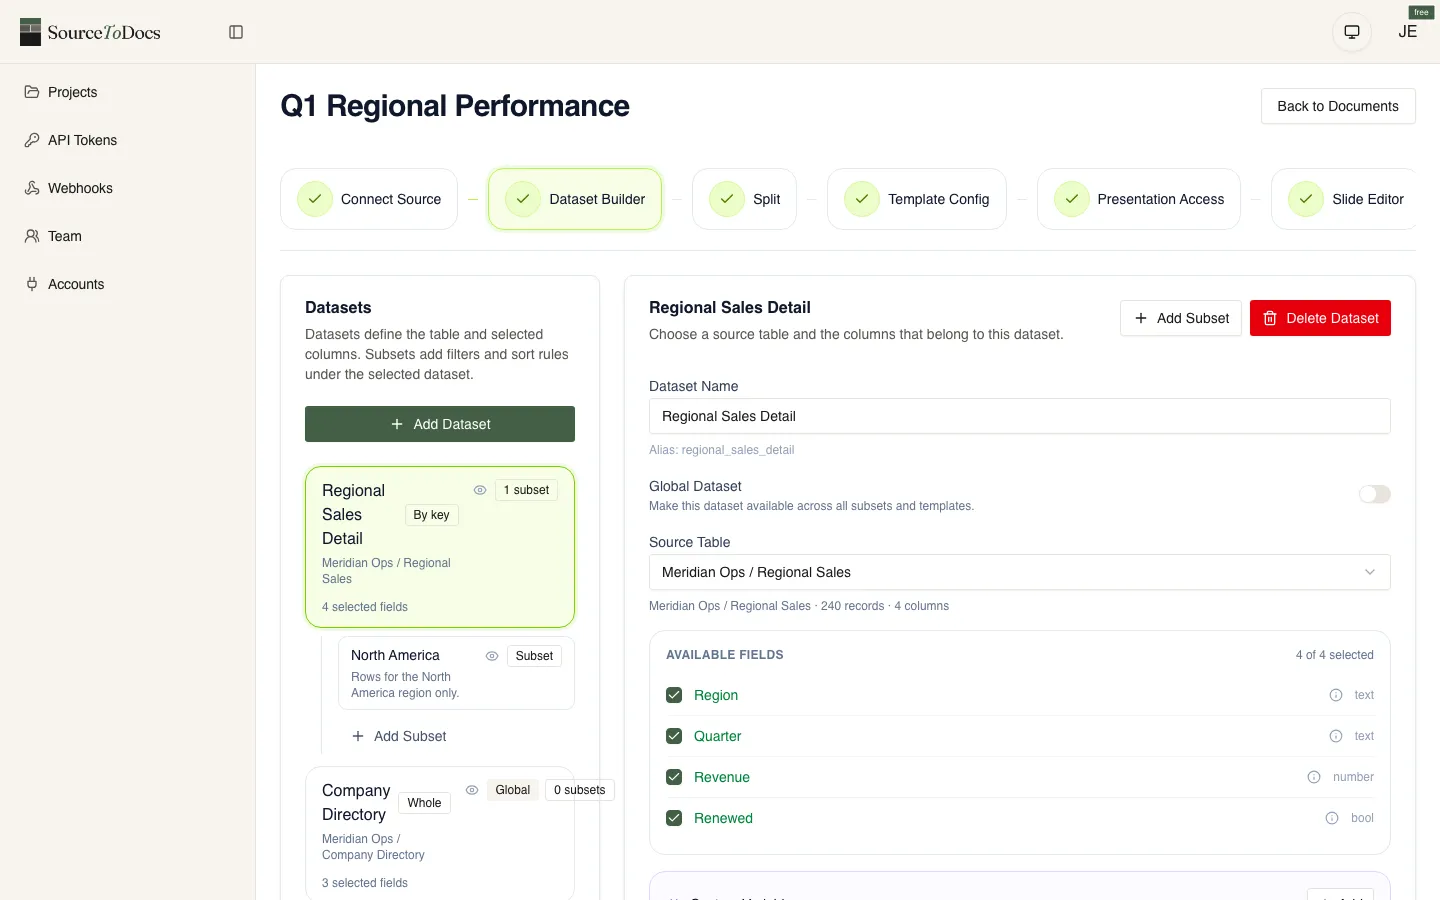
Two rules make this durable. Name placeholders after the data, not the slide, so {{account.name}} rather than {{title_slide_heading}}, because the deck will be redesigned and the data will not. And keep the linked data one hop from the driving record: a generator that reads Airtable properly will follow a link field and read the related record’s fields, but arbitrarily deep chains get fragile fast.
Start from a template that already has the placeholders
You do not have to build the deck from nothing. These are ready to run against an Airtable base, with placeholders already in place, and every one is a real Google Slides file rather than a picture of one:
The QBR deck is the closest match to the Accounts and Metrics structure above. The agency client report does the same job with a white-label cover per client. The event programme is the one to look at if your repeating unit is sessions rather than metrics, because it shows a loop nested inside a grouping.
What a run actually does
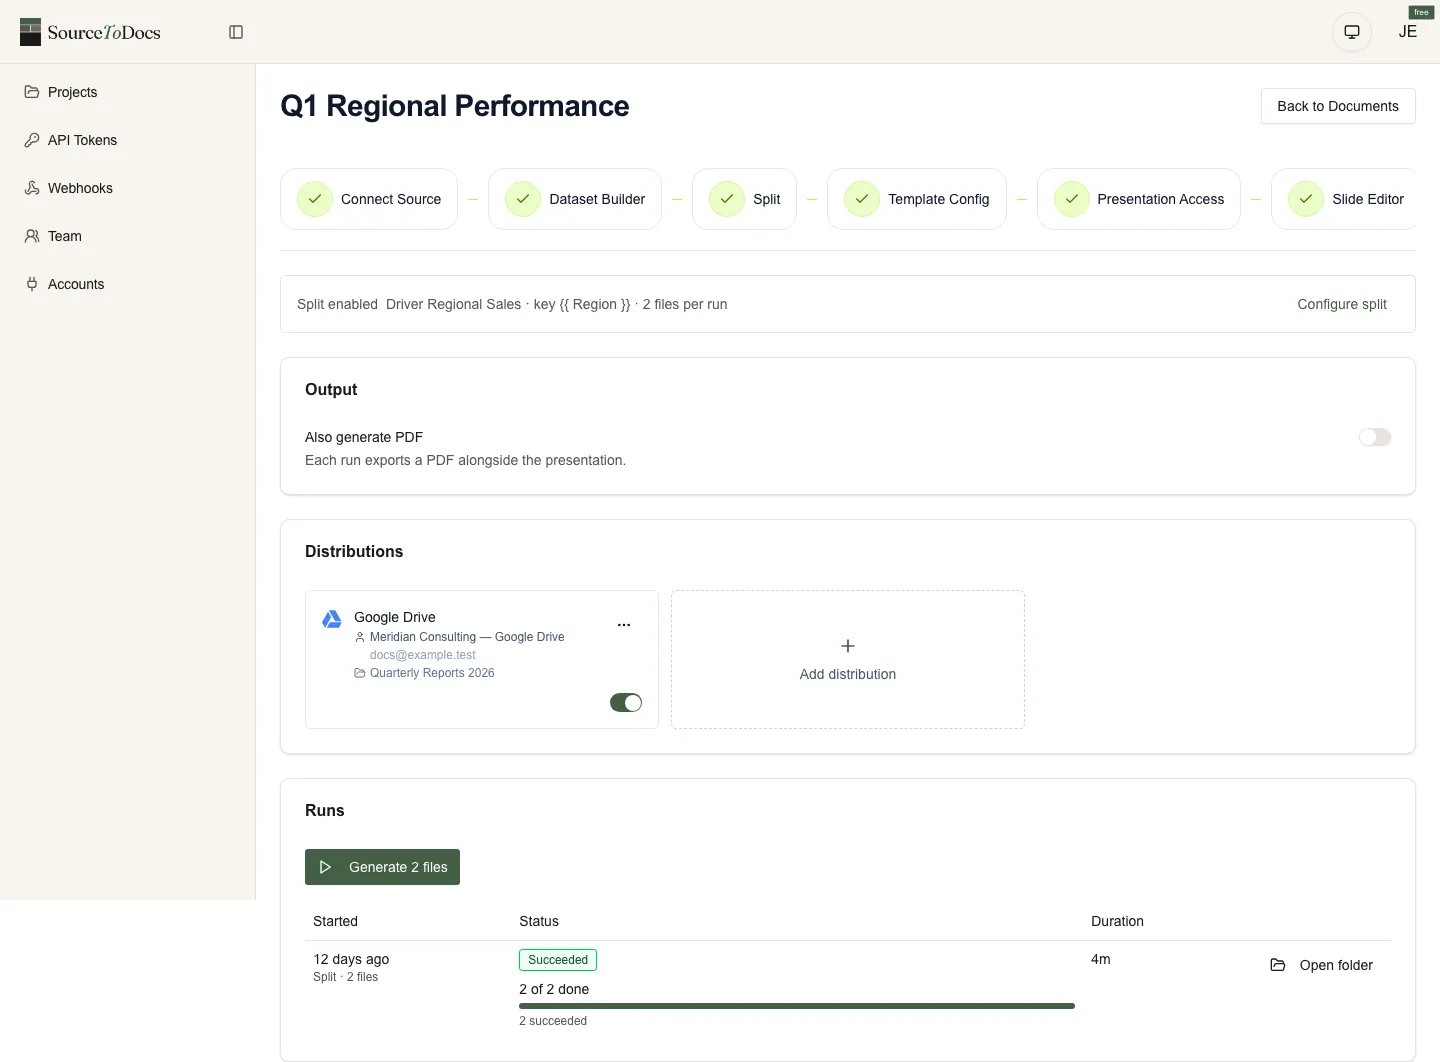
A run takes three inputs: the table (optionally filtered to a view), the template, and a destination Drive folder. For each matching row it copies the template, replaces every placeholder with that row’s values, expands each loop against the linked records, and writes the finished file to Drive. A PDF can be written alongside it, same name, same folder.
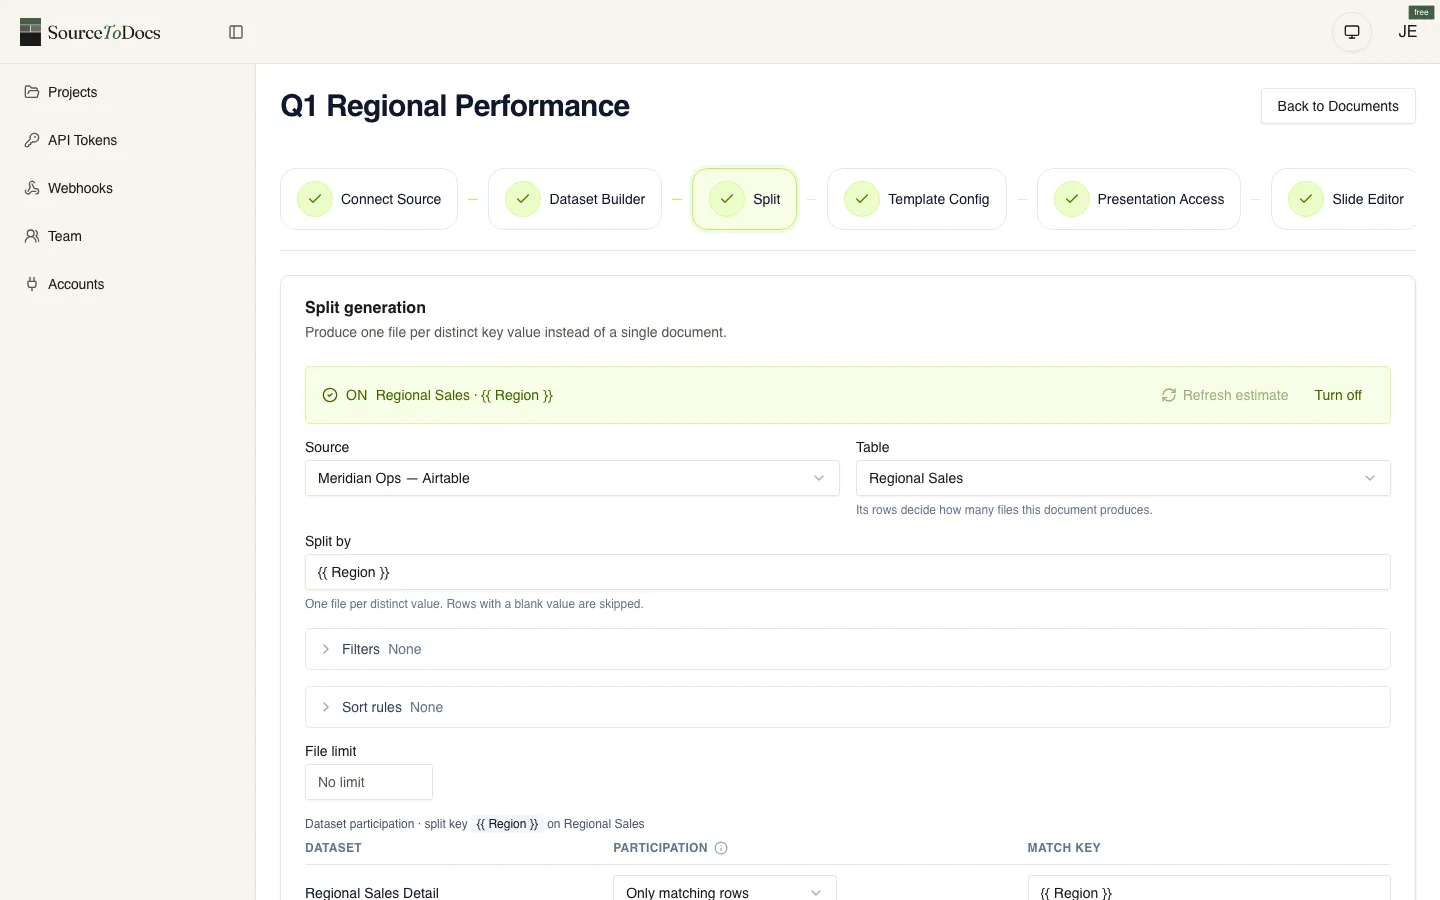
The consequence worth internalising: filtering is how you control scope. “Generate the report” becomes “generate the eleven accounts whose Quarter is Q3 and whose Health is not Churned”. You do that in the filter, not by making eleven copies of anything. Sorting works the same way, so the order of a view becomes the order of the repeating slides.
The four things that break it
Deep nesting. Following a link field to a related record is reliable. Following a link to a record that links to another record, and reading a rollup of that, is where builds get brittle. Flatten the far end into a field on the record you actually query.
Long values in fixed layouts. A Slides template has a fixed canvas, which is its strength for brand fidelity and its constraint for content. An account name of eight words will overflow a box sized for three. Either constrain the source field or design the box for the realistic maximum. If content length is genuinely unpredictable, that document wants Google Docs instead, where pages break on their own.
Empty linked records. An account with no projects should produce a deck with the projects section absent, not a deck with an empty slide and a dangling heading. Decide this per loop before you run at volume, not after someone forwards a client a blank slide.
Renaming placeholders instead of fields. The mapping survives redesign, not renaming. If a placeholder must change name, change it in the template and the mapping together. This is the failure mode that killed the Saturday-afternoon Apps Script, and it is worth naming because it is the one that returns.
When a script is still the right answer
If the deck is genuinely one-off, or the logic is so specific that no mapping expresses it, a script is fine and honest. The Apps Script walkthrough covers that path with working code, and the Slides API guide covers what the API will and will not do. The judgement is in the Google Slides automation guide: scripts are cheapest at the start and most expensive to own, and the crossover comes sooner than most teams expect.
For the recurring, branded, one-per-account case, which is most of why people search for this in the first place, the mapping approach is the one that survives the designer, the volume, and the second year.
Common questions, answered
How do I connect Airtable to Google Slides? +
Do I need to flatten my Airtable data first? +
Can one run produce a deck per client? +
How do repeating slides work, like one slide per product? +
What happens when the designer edits the template? +
Can I get a PDF as well as the Slides deck? +
Does the free plan cover this? +
Related reading
- Airtable Document Automation → Guide
- Google Slides Automation → Guide
- Document Automation → Guide
- Airtable automation examples: 12 patterns from real production setups → Blog post
- How to automate Google Slides with Apps Script: practical patterns → Blog post
- Airtable Page Designer: when it works (and what to use instead) → Blog post