Annual report template
A year-end report combining narrative sections and financial tables, generated from the year's figures held in your systems.
Free plan, no credit card. Bring your own design or start from this layout.
What’s in this template
Every block is bound to a field in your data. The layout stays exactly as designed; only the values change from one run to the next.
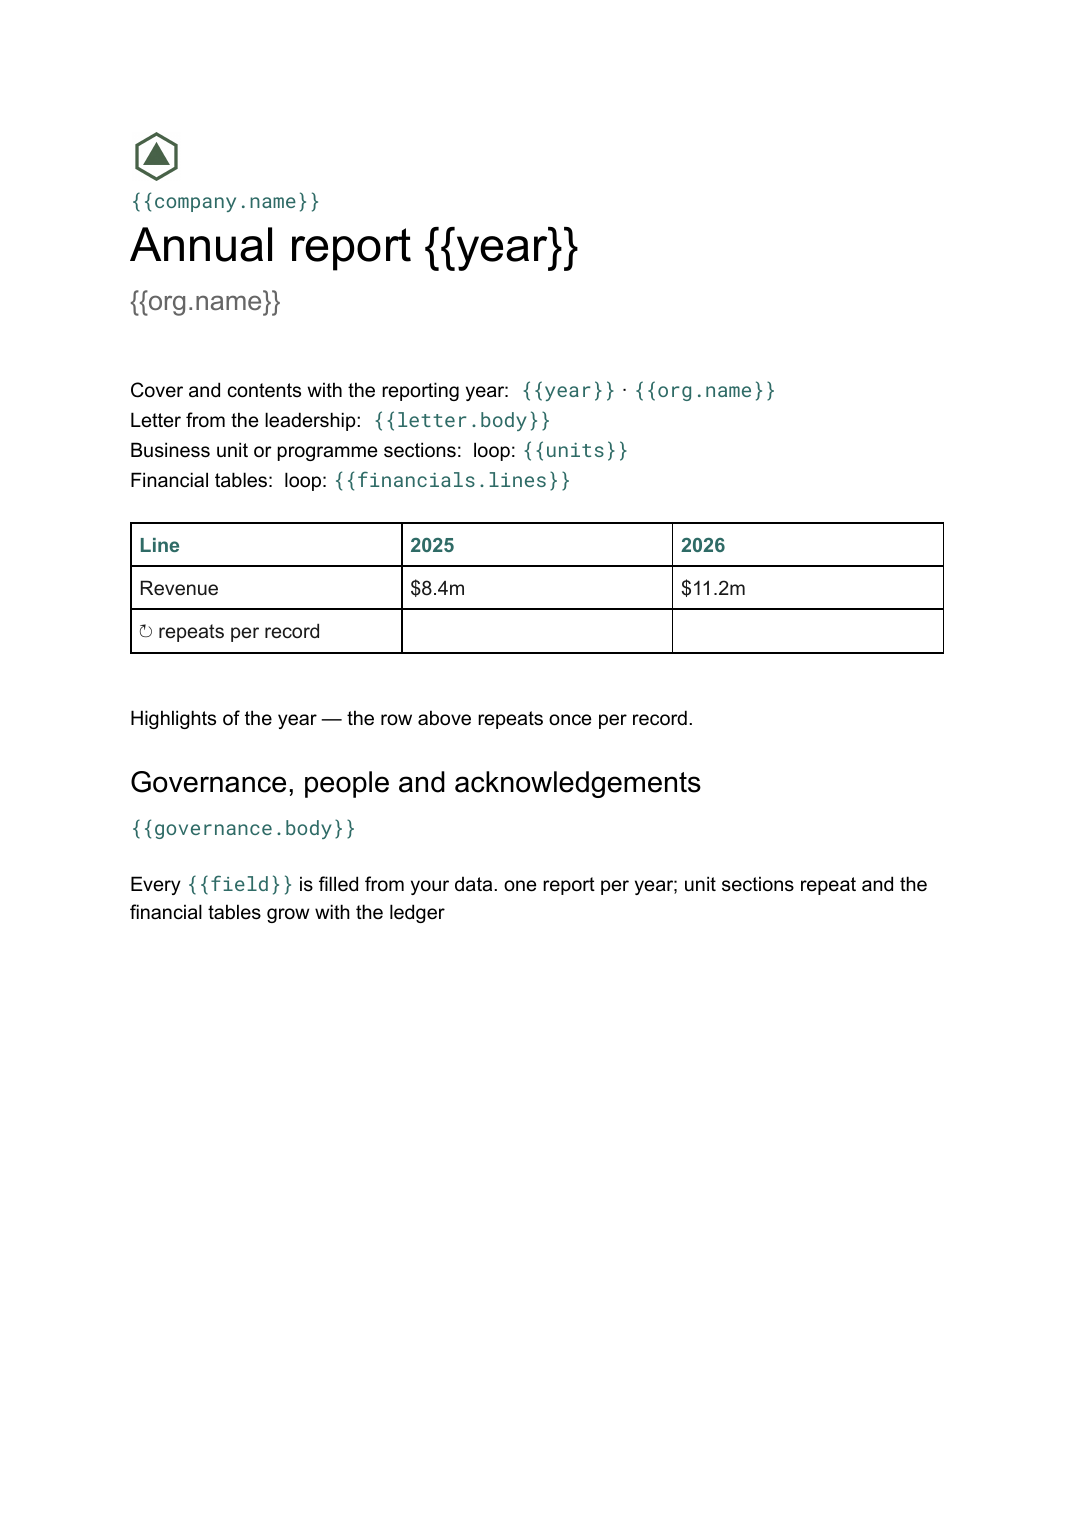
- Cover and contents with the reporting year {{year}} · {{org.name}}
- Letter from the leadership {{letter.body}}
- Highlights of the year loop: {{highlights}}
- Business unit or programme sections loop: {{units}}
- Financial tables loop: {{financials.lines}}
- Governance, people and acknowledgements {{governance.body}}
How this template fills itself
Connect Airtable, Google Sheets, a SQL database, a CSV or a REST API, map each field to a placeholder, and generate. One run can produce a single document or one per matching record.
Financials · SQL database
Template: Google Slides or Docs
Annual report {{year}}
{{org.name}}
{{letter.body}}
loop: {{units}} → section
loop: {{financials.lines}} → table row
one report per year; unit sections repeat and the financial tables grow with the ledger
Generated output
DocsPDFAnnual report 2026
Northwind Group
Letter from the chief executive
6 business unit sections
18 financial lines
Who uses this template
Nonprofits and foundations
Publish the year's figures and programme write-ups from the records you already keep for funders.
Read the guideFinance teams
Draw the financial tables from the ledger so the report and the accounts cannot disagree.
Read the guideAssociations and membership bodies
Produce the same annual document each year without rebuilding it from the previous edition.
Read the guideThe annual report is the one document a year that everyone dreads assembling. It is long, it mixes narrative with tables, several people own different sections, and the figures keep moving until quite late. The pain is rarely the writing; it is the twelfth reflow after finance revises a number and every table below it shifts.
Separate the words that change from the numbers that move
Split the report in two before you start. The narrative — the letter, the highlights, the section commentary — is written once and changes slowly. The tables come from the ledger and change until sign-off. Bind the tables to your financial source and leave them alone, so a revised figure means a regenerated document rather than an afternoon of manual retyping and re-checking. Give each business unit or programme a record so its section is produced by a loop, and adding a seventh unit next year becomes a row in a table rather than a redesign of the document.
Related templates
All reports →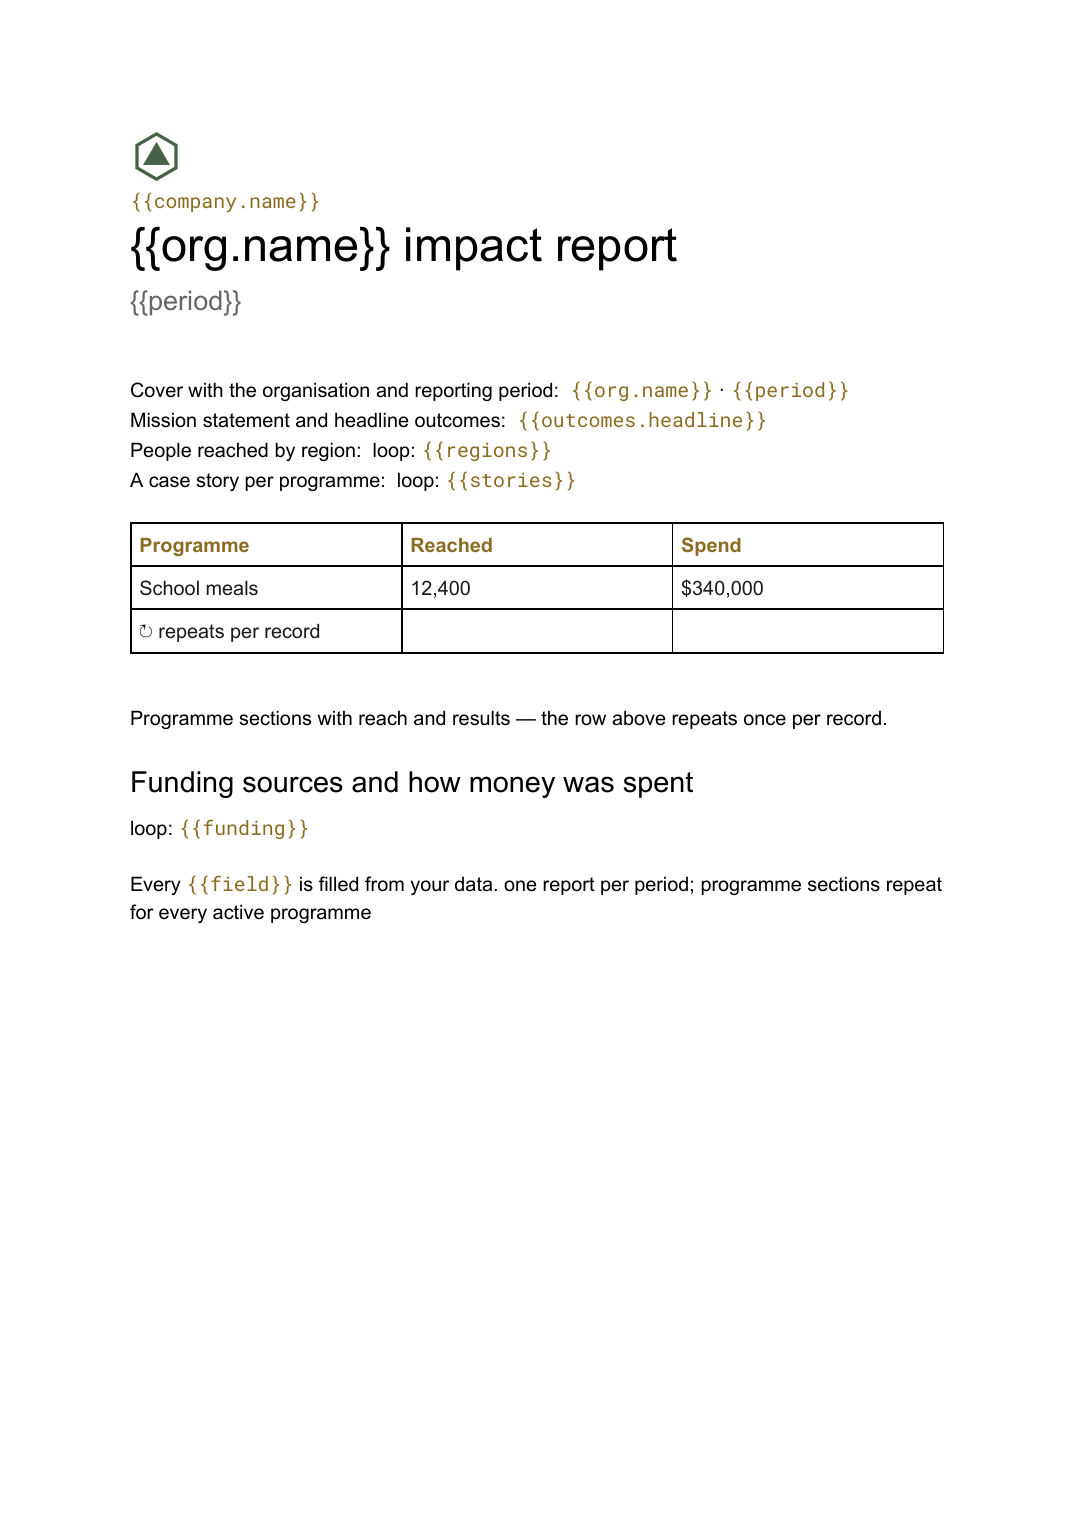 Google Docs
 Impact report template
A programme-by-programme account of outcomes and reach, generated from the monitoring data your team already collects.
View template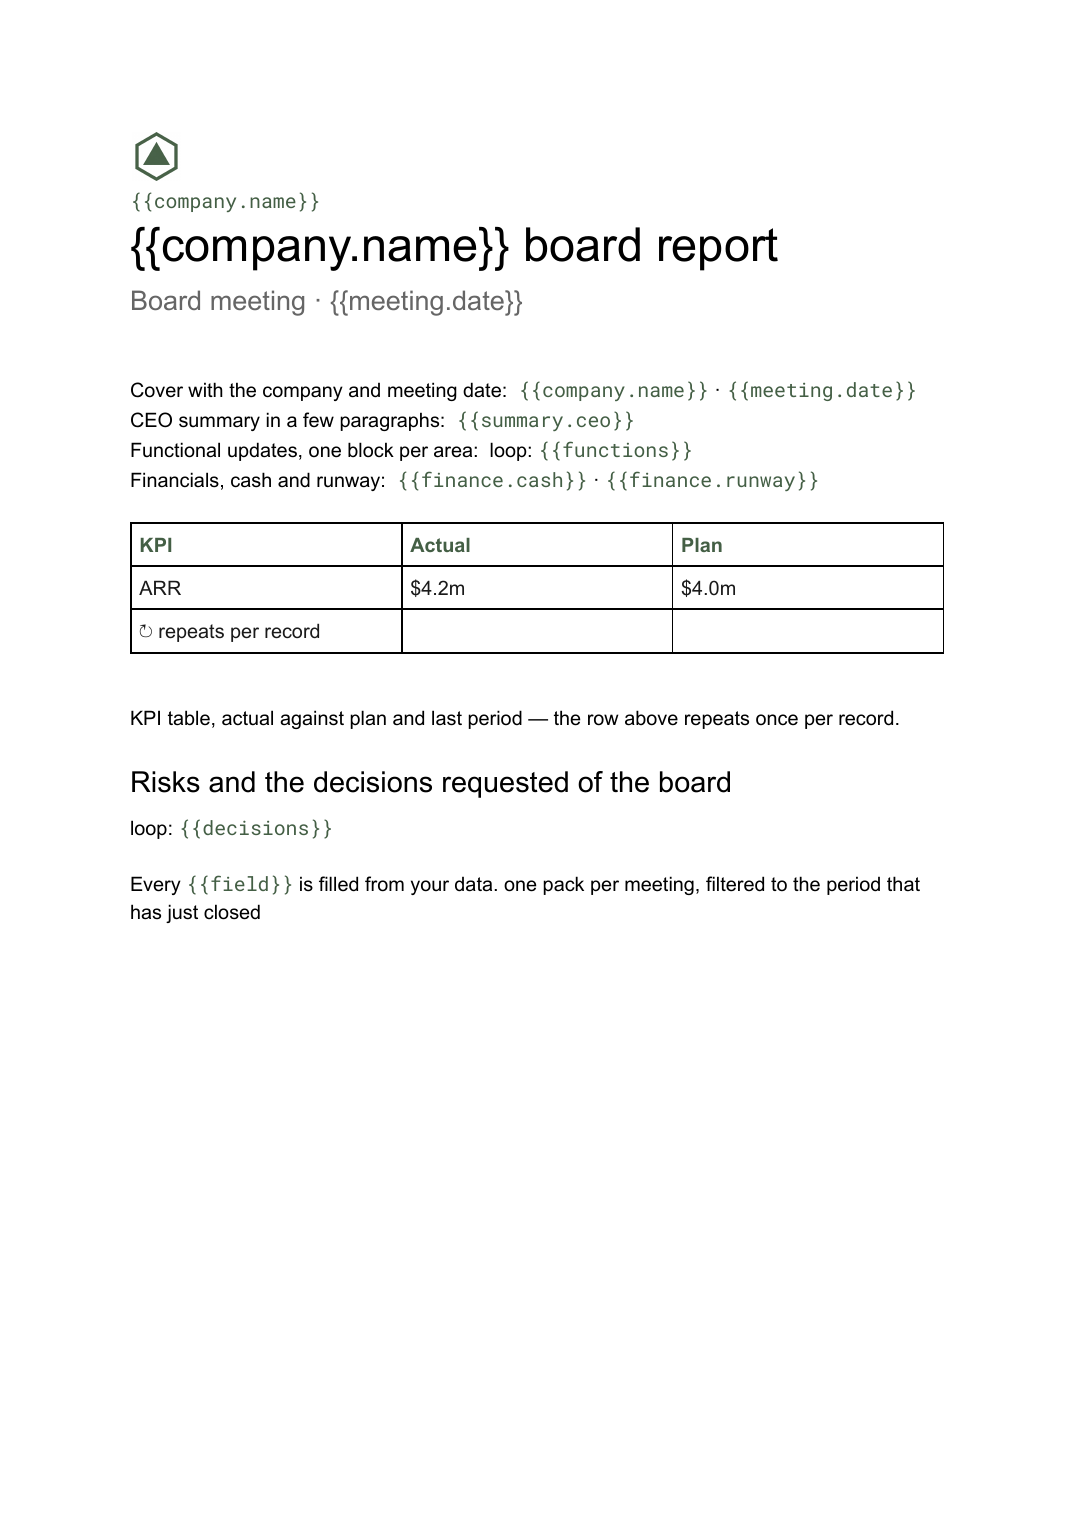 Google Docs
 Board report template
The written pre-read pack sent to directors before a board meeting, generated per meeting from your KPI and financial data.
View template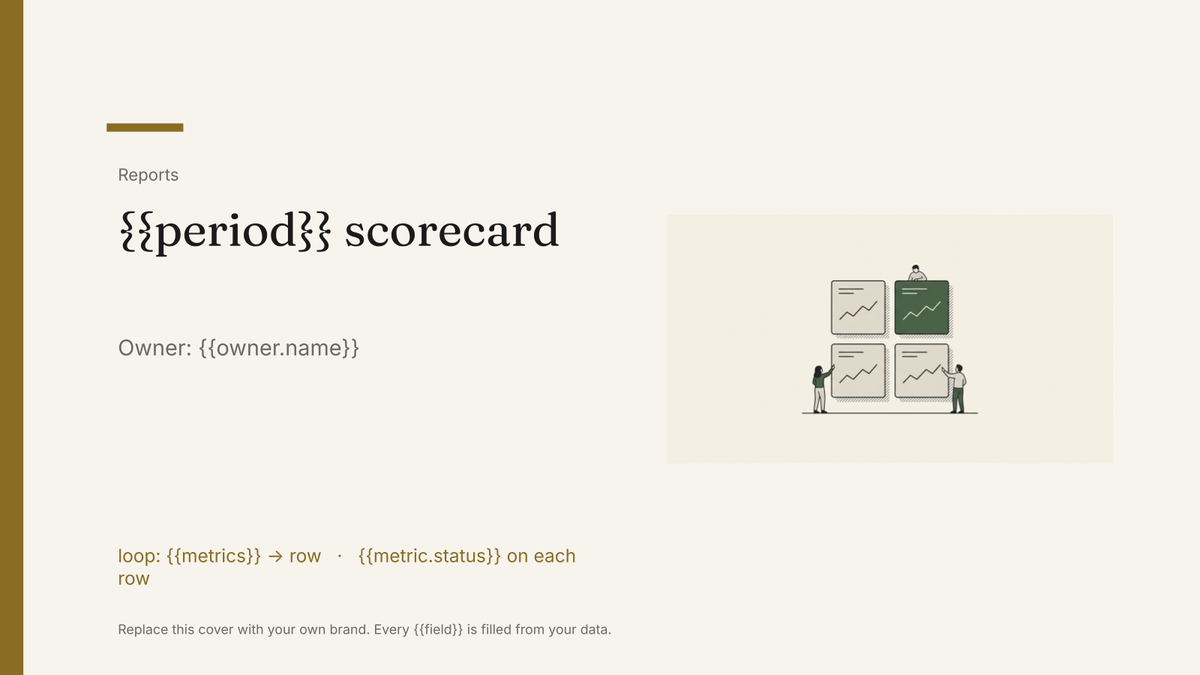 Google Slides
 KPI scorecard template
A one-page KPI scorecard showing target, actual and variance per metric, generated each period from your reporting data.
View template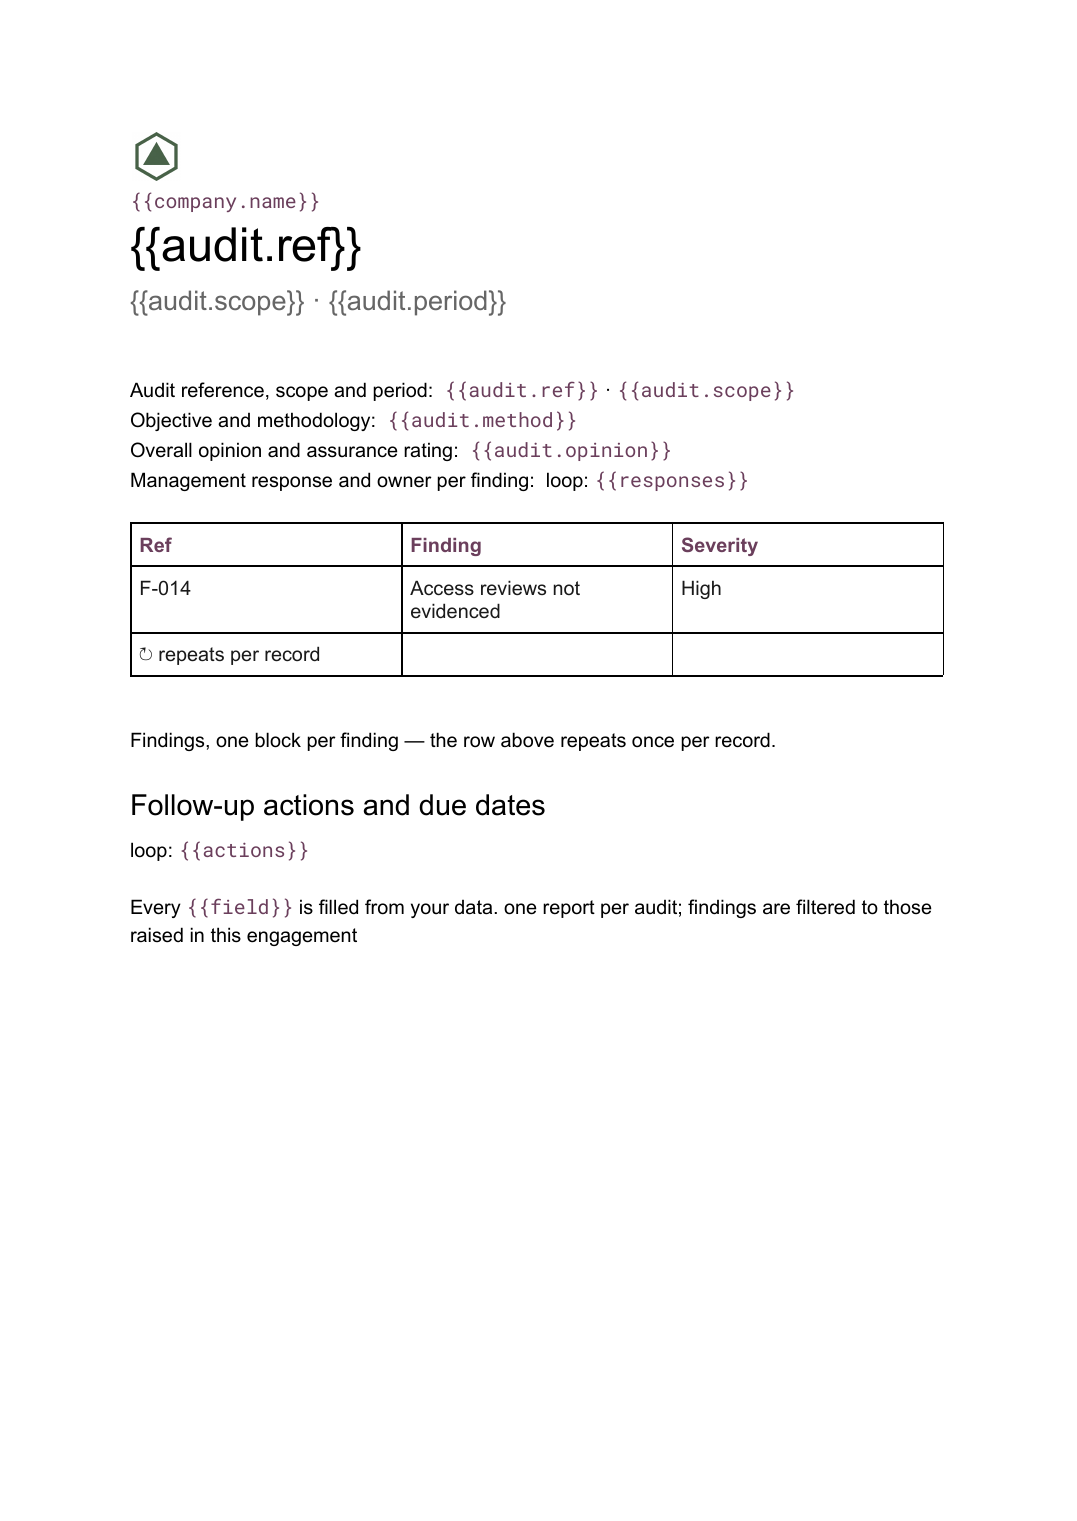 Google Docs
 Audit report template
A per-audit report setting out scope, findings with severity and management responses, generated from your findings register.
View templateCommon questions, answered
An annual report is a long document. Why Google Docs? +
Where do the financial tables come from? +
Who writes the narrative parts? +
Can I use our own annual report design? +
Generate this document from your data
Start on the free plan, connect a data source, and export a real Google Docs document. No watermark, no credit card.