Board deck template
The presented version of the board pack, built in Google Slides and generated each cycle from your KPI and financial data.
Free plan, no credit card. Bring your own design or start from this layout.
What’s in this template
Every block is bound to a field in your data. The layout stays exactly as designed; only the values change from one run to the next.
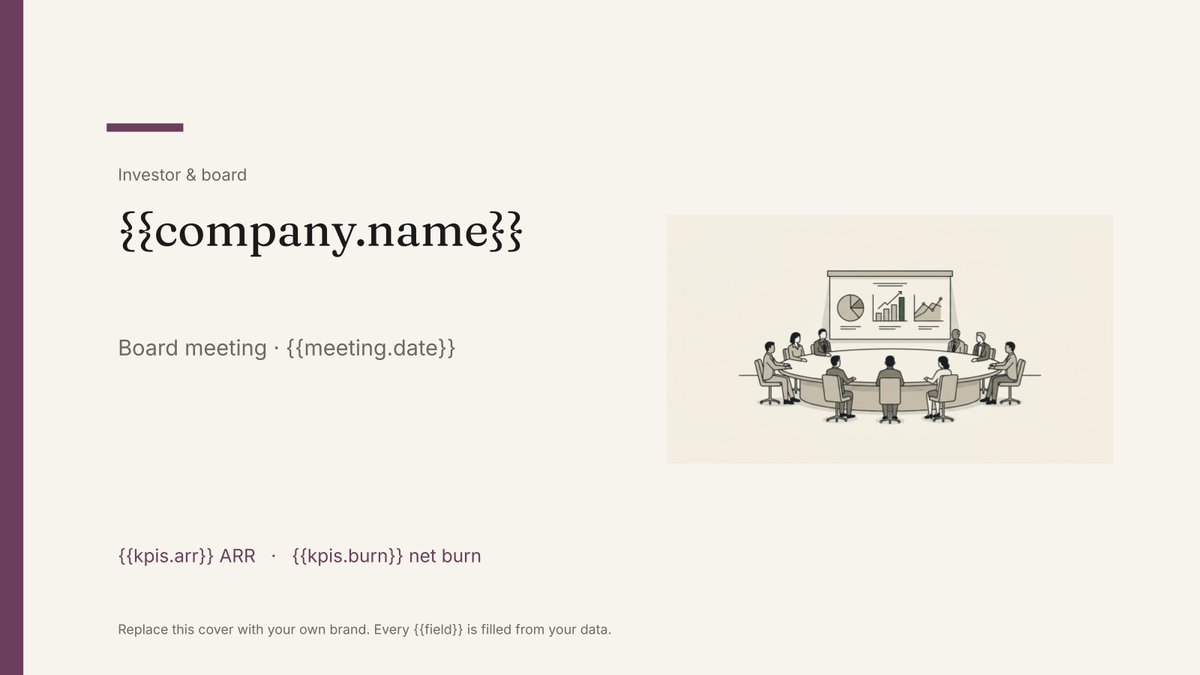
- Cover with the company and meeting date {{company.name}} · {{meeting.date}}
- Agenda slide for the session loop: {{agenda}}
- Headline metrics tiles {{kpis.arr}} · {{kpis.burn}} · {{kpis.runway}}
- Performance against plan, one slide per function loop: {{functions}}
- Chart block bound to the period data {{charts.arr_trend}}
- Decisions requested, one slide loop: {{decisions}}
- Appendix of detail slides loop: {{appendix}}
How this template fills itself
Connect Airtable, Google Sheets, a SQL database, a CSV or a REST API, map each field to a placeholder, and generate. One run can produce a single document or one per matching record.
Board KPIs · Google Sheets
Template: Google Slides or Docs
{{company.name}}
Board meeting · {{meeting.date}}
{{kpis.arr}} ARR
{{kpis.burn}} net burn
loop: {{decisions}} → slide
one deck per meeting, filtered to the period that has just closed
Generated output
SlidesPDFNorthbeam
Board meeting · 17 Sep 2026
$4.2m ARR
$310k net burn
4 decision slides
Who uses this template
Founders and CEOs
Walk the board through the quarter in a deck that looks identical every cycle, so directors track the change rather than the layout.
Read the guideChiefs of staff and finance leads
Rebuild the deck from the KPI sheet in one run instead of collecting slides from every function the week before.
Read the guidePortfolio and operating teams
Standardise the board deck across companies and generate the whole set on one cycle.
Read the guideThe board deck is the presented half of the board pack: the version you talk to in the room, where the pacing of the slides is part of the argument. That makes Google Slides the right home for it — the tiles, charts and per-function slides keep the position a designer gave them, and nothing shifts because ARR gained a digit. Its written twin, the board report, does the opposite job for the reading that happens beforehand.
Let the repeating slides come from rows
The slides that make a deck tedious to rebuild are the ones that repeat: a slide per function, a slide per decision, an appendix that changes length. Those come from a loop over records rather than from copying a slide and editing it. Keep one row per function with its owner, headline number and commentary, and one row per decision with the ask and the recommendation, and the deck’s length follows the quarter instead of being trimmed to fit. The usual failure is a deck where last quarter’s slide was duplicated and one tile never got updated — generating removes that failure entirely, because no slide survives from one run to the next.
Related templates
All investor & board →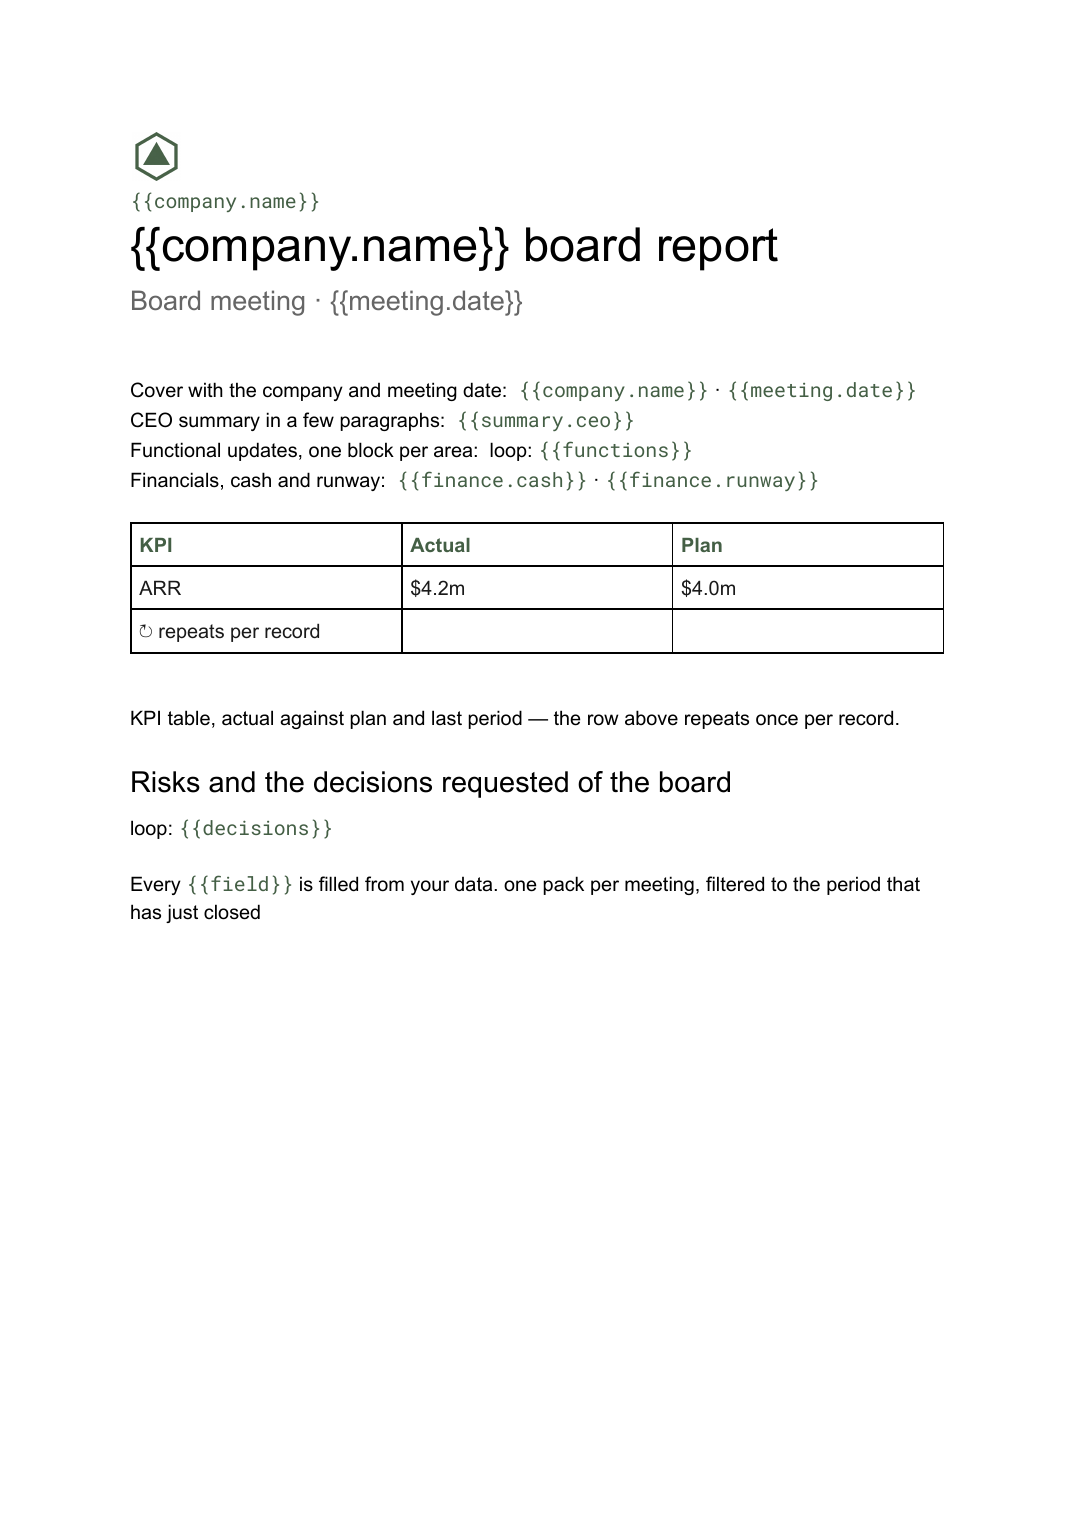 Google Docs
 Board report template
The written pre-read pack sent to directors before a board meeting, generated per meeting from your KPI and financial data.
View template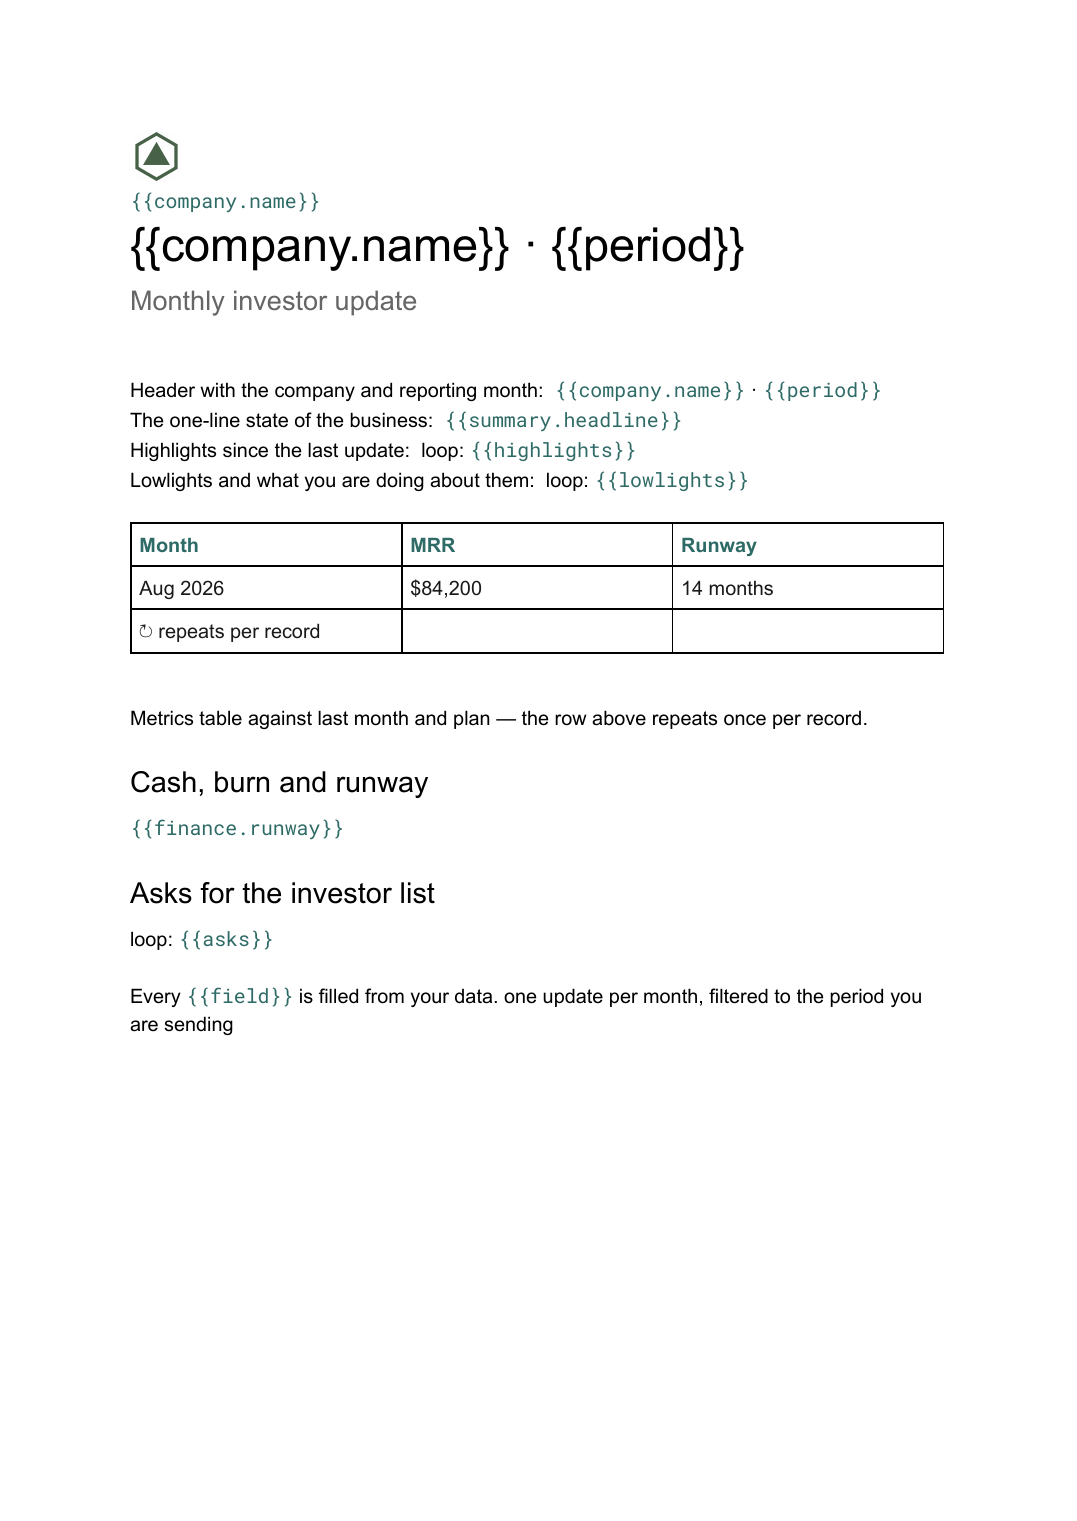 Google Docs
 Investor update template
A founder's monthly written update to angels and VCs covering metrics, progress and asks, generated per reporting period from your data.
View template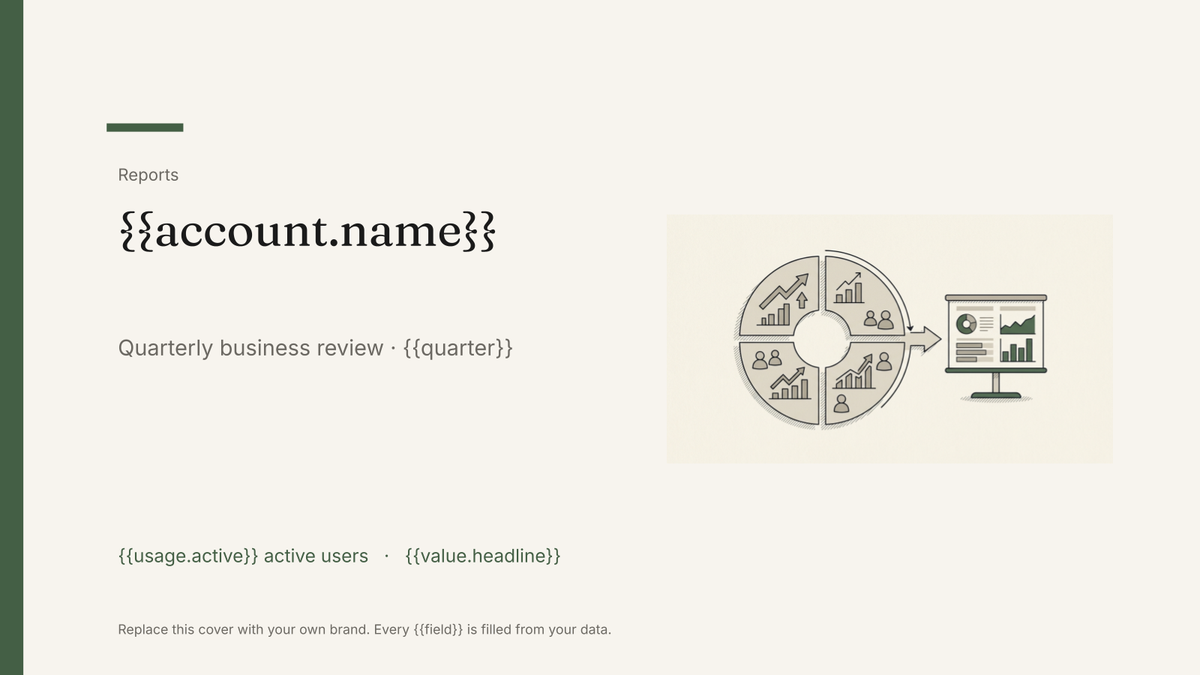 Google Slides
 QBR deck template
A quarterly business review deck covering value delivered, adoption and next-quarter plans, generated one per account from your customer data.
View template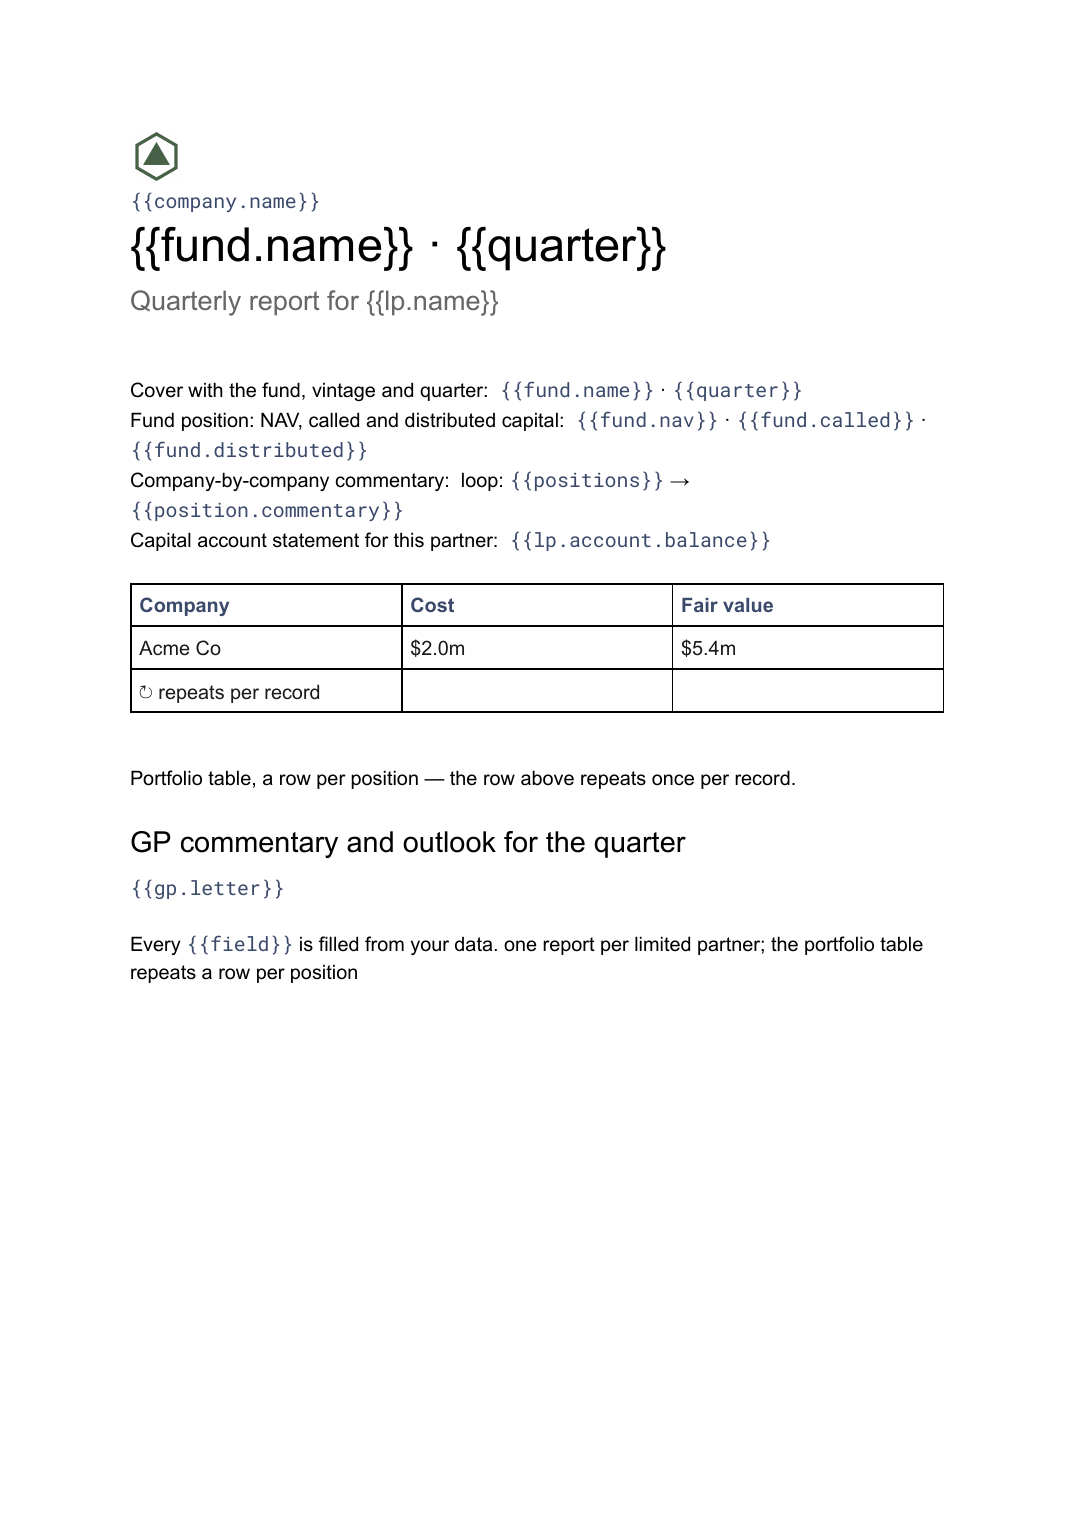 Google Docs
 LP quarterly report template
A fund manager's quarterly report to limited partners covering fund position, portfolio companies and each partner's capital account, generated one per LP.
View templateCommon questions, answered
Should I use the deck or the written board report? +
Why Slides rather than a document? +
Where do the numbers and charts come from? +
Can I use our own deck design? +
Generate this document from your data
Start on the free plan, connect a data source, and export a real Google Slides document. No watermark, no credit card.