Investor update template
A founder's monthly written update to angels and VCs covering metrics, progress and asks, generated per reporting period from your data.
Free plan, no credit card. Bring your own design or start from this layout.
What’s in this template
Every block is bound to a field in your data. The layout stays exactly as designed; only the values change from one run to the next.
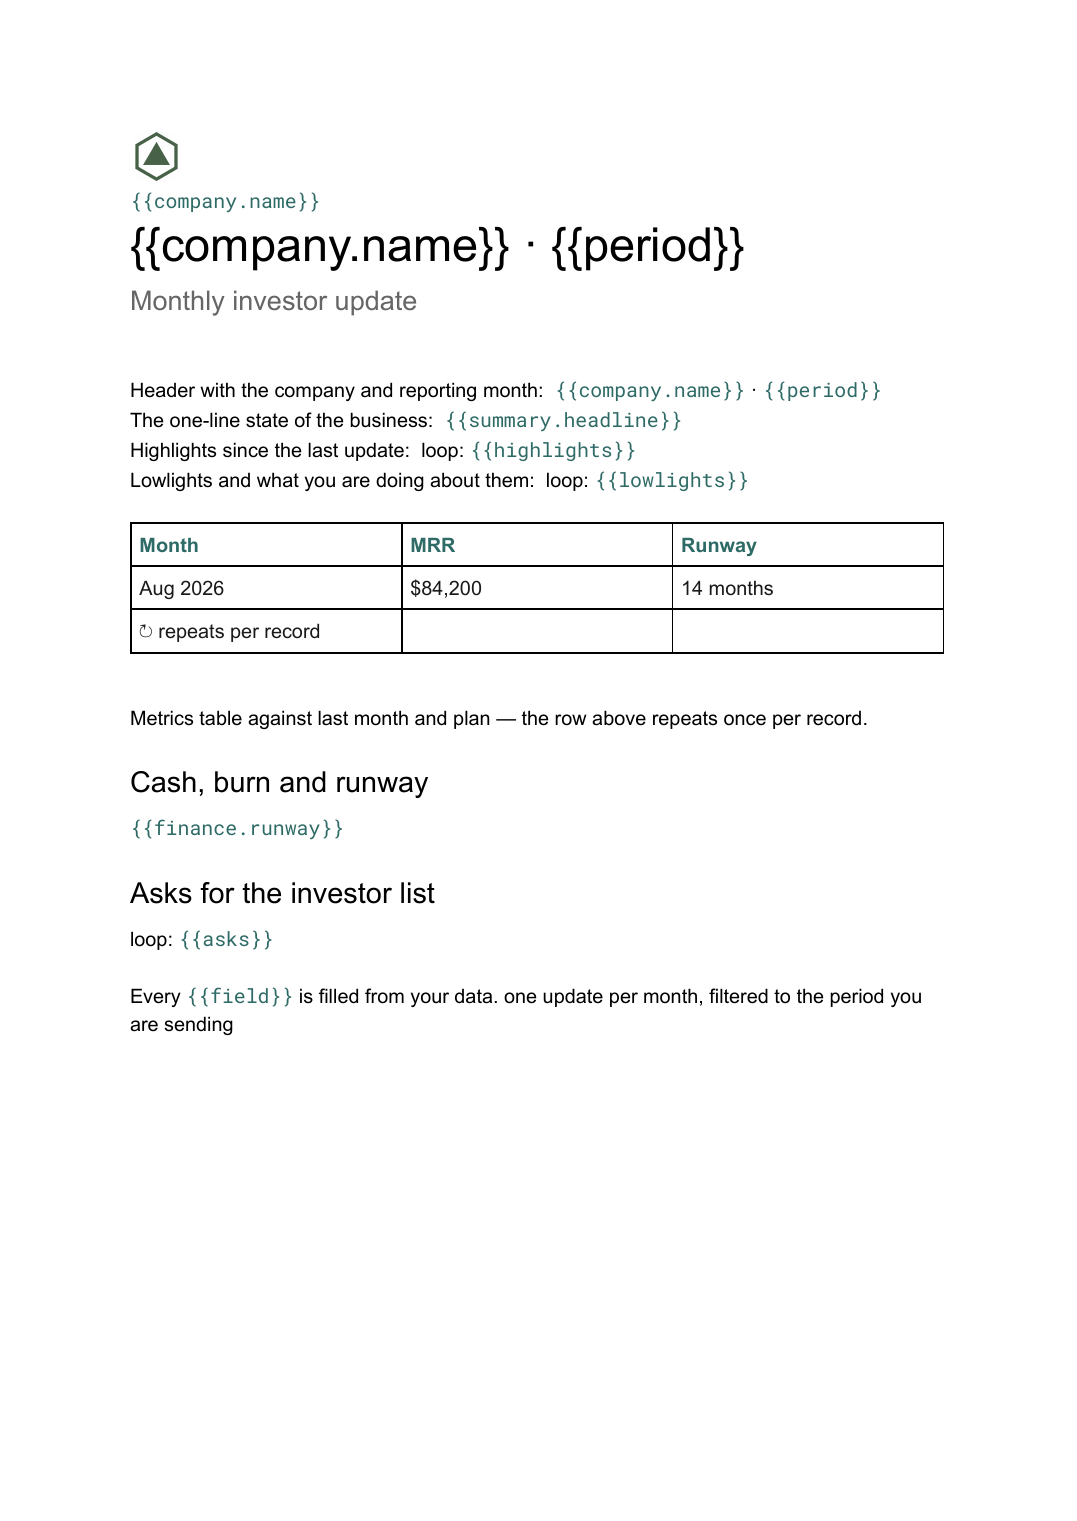
- Header with the company and reporting month {{company.name}} · {{period}}
- The one-line state of the business {{summary.headline}}
- Metrics table against last month and plan loop: {{metrics}}
- Highlights since the last update loop: {{highlights}}
- Lowlights and what you are doing about them loop: {{lowlights}}
- Cash, burn and runway {{finance.runway}}
- Asks for the investor list loop: {{asks}}
How this template fills itself
Connect Airtable, Google Sheets, a SQL database, a CSV or a REST API, map each field to a placeholder, and generate. One run can produce a single document or one per matching record.
Monthly metrics · Airtable
Template: Google Slides or Docs
{{company.name}} · {{period}}
Monthly investor update
{{metrics.mrr}} MRR
{{finance.runway}} runway
loop: {{asks}}
one update per month, filtered to the period you are sending
Generated output
DocsPDFNorthbeam · Aug 2026
Monthly investor update
$84,200 MRR
14 months runway
3 asks for the list
Who uses this template
Founders raising and raised
Send the same shaped update every month so investors can read the trend rather than re-learn your format.
Read the guideChiefs of staff and finance leads
Assemble the update from the numbers already tracked instead of chasing screenshots at month end.
Read the guideAccelerators and venture studios
Give every portfolio company one update format and generate the batch from a single tracker.
Read the guideThe monthly investor update is a short document with a fixed set of sections and a variable amount of substance: some months the highlights run long, some months the ask is a single line. That is why it works better as a Google Doc than a deck. The sections flow, the metrics table grows if you start tracking another number, and the pages break themselves rather than forcing you to cut a sentence to fit a slide.
The five sections that survive contact with a cap table
Strip away the variations and the structure most Series A founders converge on is short. Five sections, in this order, every month, two screens of scroll, readable on a phone in a coffee queue.
| # | Section | Length | What goes in it |
|---|---|---|---|
| 1 | Highlights | 3–5 bullets | The things investors should remember if they only read the first screen: logo wins, a hire that closes a known gap, a milestone that moved something |
| 2 | Lowlights | 2–3 bullets | What is not going to plan, framed honestly: a churned account and why, a hire that fell through, a metric that moved the wrong way |
| 3 | KPIs | One block | The same numbers every month, against last month and plan |
| 4 | Asks | 2–3 items | Specific things the network can act on: a named hire, a named customer segment, one question an engaged investor can answer in five minutes |
| 5 | What’s next | 2–3 sentences | Next month’s milestones, the board date, the raise if it is appropriate to flag |
Three rules make the difference between an update that gets read and one that gets archived:
- Each highlight should be something a board member would repeat at Monday meeting. If they would not pass it on, it is not a highlight. Investors recognise padding immediately and the trust cost is high.
- Lowlights are where the network actually helps. The angel who has seen a churn cliff before will email the day they read about yours. Founders skip this section most and lose most by skipping it.
- A generic ask is no ask. “Let me know if you can help” gets ignored. “We are hiring a Head of Sales with mid-market healthcare experience” gets three referrals.
The KPI block, month over month
| Metric | What to show | Add for your model |
|---|---|---|
| Revenue | MRR or ARR, with growth vs prior month and prior quarter | SaaS: NRR, gross margin, CAC payback |
| Customers | Total, net new, churned (or active accounts) | Marketplace: GMV, take rate |
| Runway | Months at current burn, with a note if burn is changing | Infrastructure: paying customers, ARR per customer |
| Headcount | Total, with hires and departures |
Stability of the metric set is itself a signal. Investors are looking for the same four to seven numbers every month so they can read the trend; a rotating dashboard reads as a founder who has not decided what matters yet.
Two worked examples
Both anonymised, both real in shape.
An early-stage AI infrastructure company
Series A, eighteen months in, $4M ARR, fifteen employees, ten months of runway. Lead VC at partner level, three follow-on funds, fifteen angels.
Highlights
- Closed a six-figure ACV deal with a top-tier model lab, the first lighthouse customer in that segment.
- Hired a Head of Engineering from a hyperscaler, closing a seat that had been open four months.
- Launched inference routing; first three customers migrated.
Lowlights
- One mid-market customer churned, citing an internal build-vs-buy decision. Not a segment signal, but tracked.
- The enterprise rollout flagged in January has slipped to April: legal review on their side.
KPIs — ARR $4.0M (+8% MoM, +35% QoQ) · 47 paying customers (3 new, 1 churned) · 10 months runway at $380k/mo burn · headcount 15 (+1)
Asks
- A senior PMM who has marketed to ML engineers. Referrals welcome.
- Two introductions to GTM leaders who have sold inference-layer infrastructure into model labs.
What’s next — March is the enterprise rollout going live and standing up the channel motion. Board meeting 28 March; pre-read the week before.
A B2B SaaS at $3M ARR
Series A, two and a half years in, $3M ARR, twenty employees, fourteen months of runway. Lead VC, one follow-on, twelve angels, thirty employees with options.
Highlights
- NRR up to 118%, the first month above 115% in two quarters.
- Largest contract to date: a three-year commit with a portfolio company of the lead.
- Shipped the integrations release promised since November.
Lowlights
- Founder-led sales is running out of road: first month a deal that should have closed did not.
- Top SDR resigned. Search open; expect three weeks of softer pipeline coverage.
KPIs — ARR $3.0M (+5% MoM, +22% QoQ) · 92 paying customers (4 new, 1 churned) · 14 months runway at $210k/mo burn · headcount 20 (one open SDR seat)
Asks
- A VP Sales, the first sales hire above the IC layer. Especially keen to hear from anyone who hired a first VP at this stage.
- Two customer introductions in financial services, the vertical we are leaning into.
What’s next — April is the VP Sales hire and the financial-services beachhead. Board meeting 5 May.
Keep the numbers in the source, write only the judgement
Roughly half an update is figures you already hold and half is judgement nobody else can write. Keep the first half where it lives, an Airtable base or a Google Sheet with a row per month, and put the commentary in text fields beside it. The template then places both, and the update goes out on the same day whether or not anyone had time to rebuild last month’s file. The common failure is the reverse arrangement, where numbers are typed straight into the document: a figure gets corrected in one place, and a week later the board pack quietly disagrees with what your investors were told.
When to automate, and when not to
For a single update to a single investor list, this template plus a calendar reminder is the entire system. Do not build more.
The complication arrives when the cap table fragments. The lead wants deeper KPI commentary; the angels want narrative; the advisers want headlines; employees with options want runway and milestones, not the strategic asks. Same five sections, three cuts of the data. Writing one update takes ninety minutes. Writing three cuts takes four hours, and that is the cliff where the monthly update turns from a discipline into a chore that gets skipped.
| Cap table | Approach |
|---|---|
| Under ~30 people, one investor class | Write it by hand. The discipline is the value. |
| Several investor classes, same monthly cycle | Numbers and narrative in one source, three generated cuts: deep, light, employee |
| Portfolio of companies (accelerator, studio) | One tracker, one template, a batch of updates per month |
Below the seam, manual is correct. Above it, generating from one source buys back the four hours a month the cuts cost. The investor update automation guide covers the architecture; the quarterly LP report is the downstream document your investors build from these.
How to start in thirty minutes
Fill in the five sections for your most recent month, without optimising. Send it to your lead and one trusted angel and ask which sections they read and which they skipped. That answer compresses six months of iteration into a Tuesday afternoon. Once the structure is stable, decide whether you have one investor class or several, and only then decide whether to automate.
Related templates
All investor & board →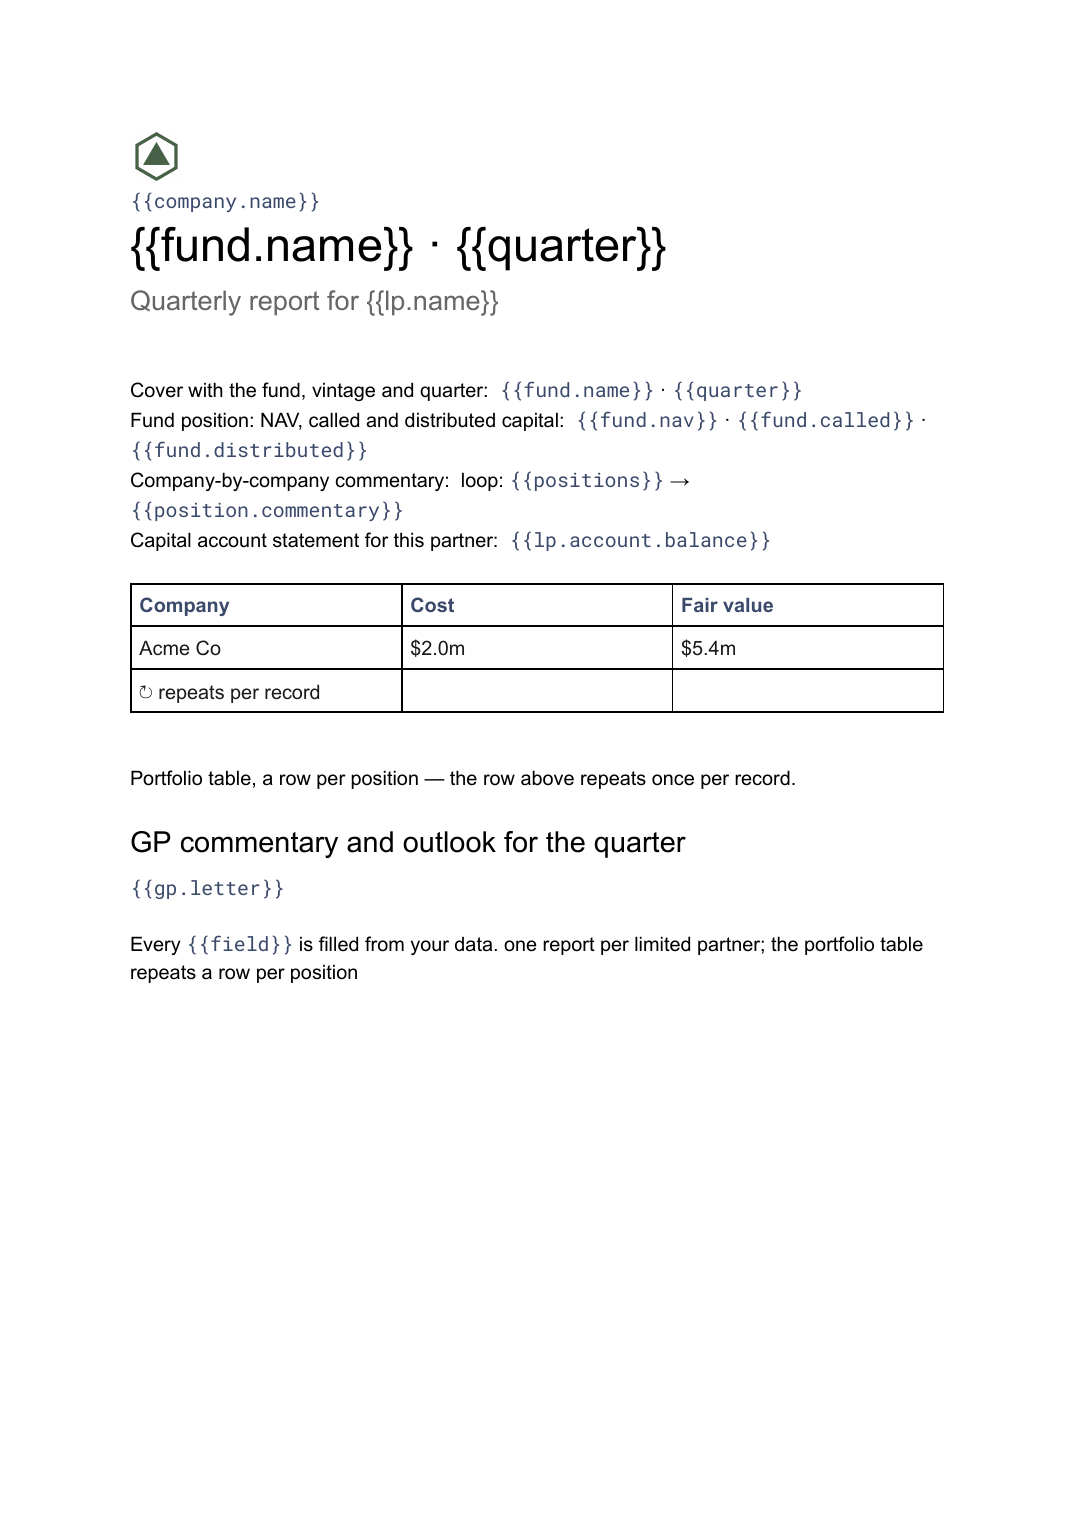 Google Docs
 LP quarterly report template
A fund manager's quarterly report to limited partners covering fund position, portfolio companies and each partner's capital account, generated one per LP.
View template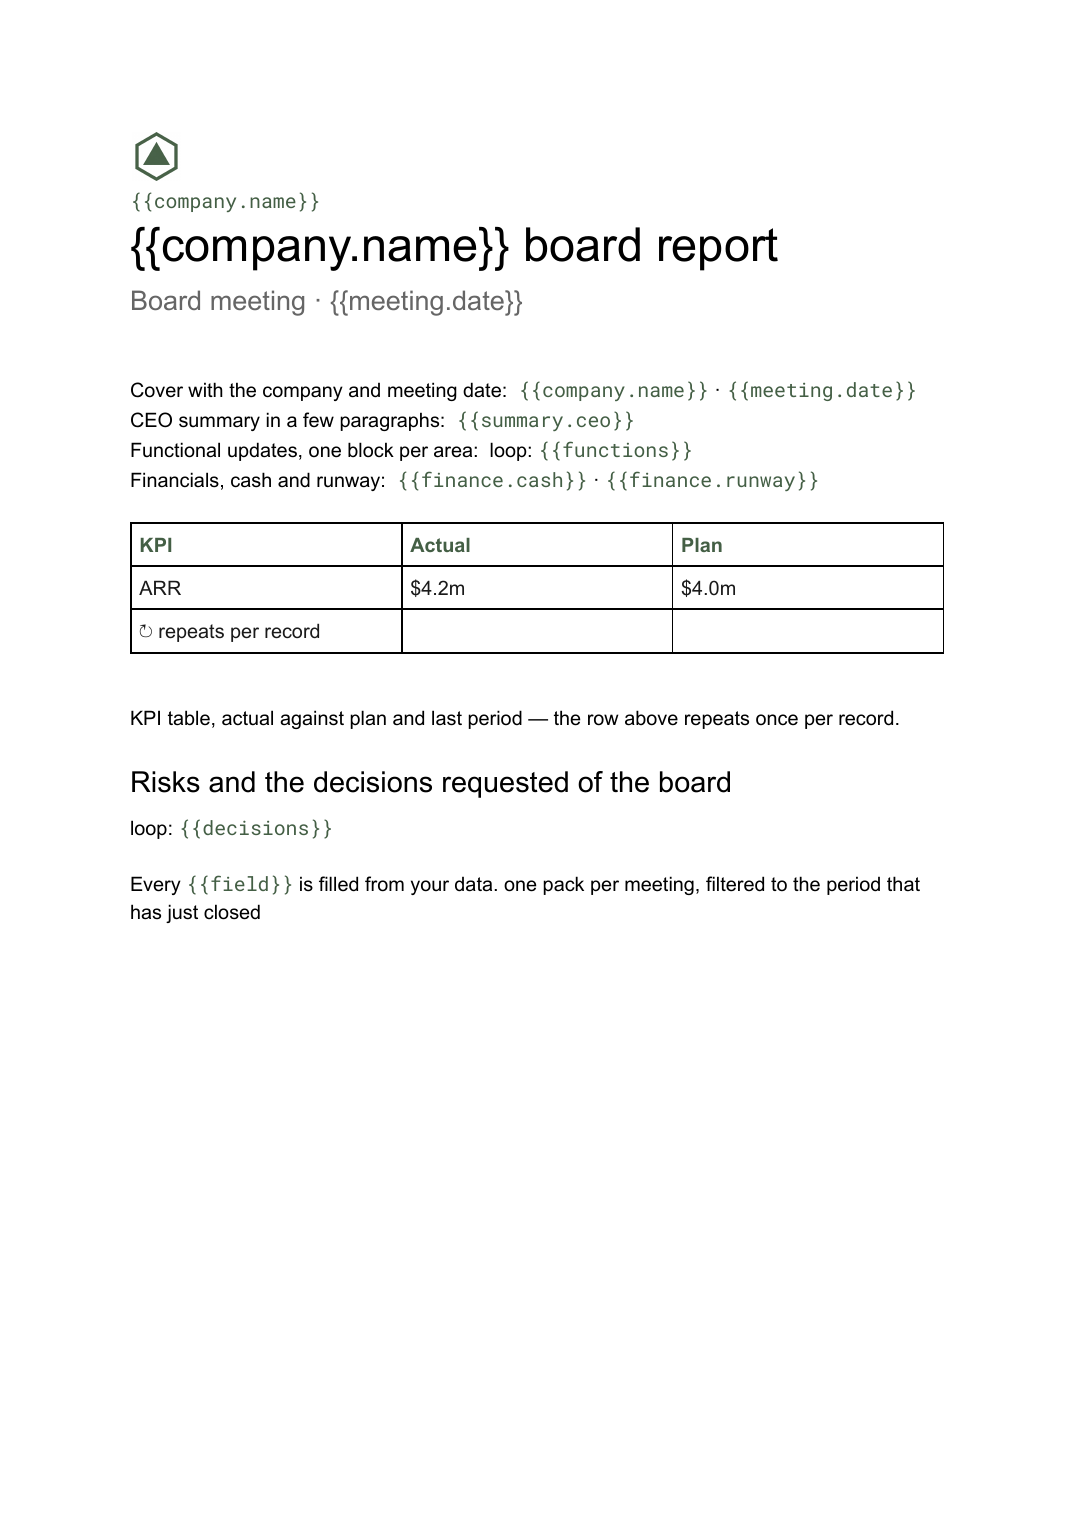 Google Docs
 Board report template
The written pre-read pack sent to directors before a board meeting, generated per meeting from your KPI and financial data.
View template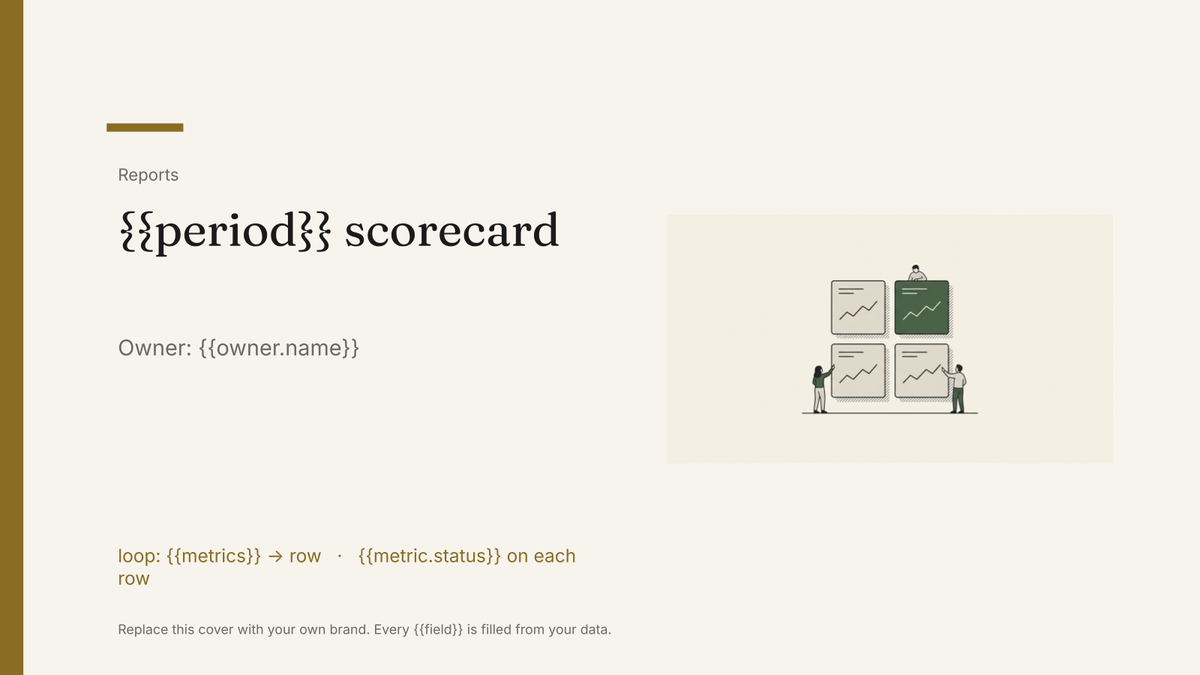 Google Slides
 KPI scorecard template
A one-page KPI scorecard showing target, actual and variance per metric, generated each period from your reporting data.
View template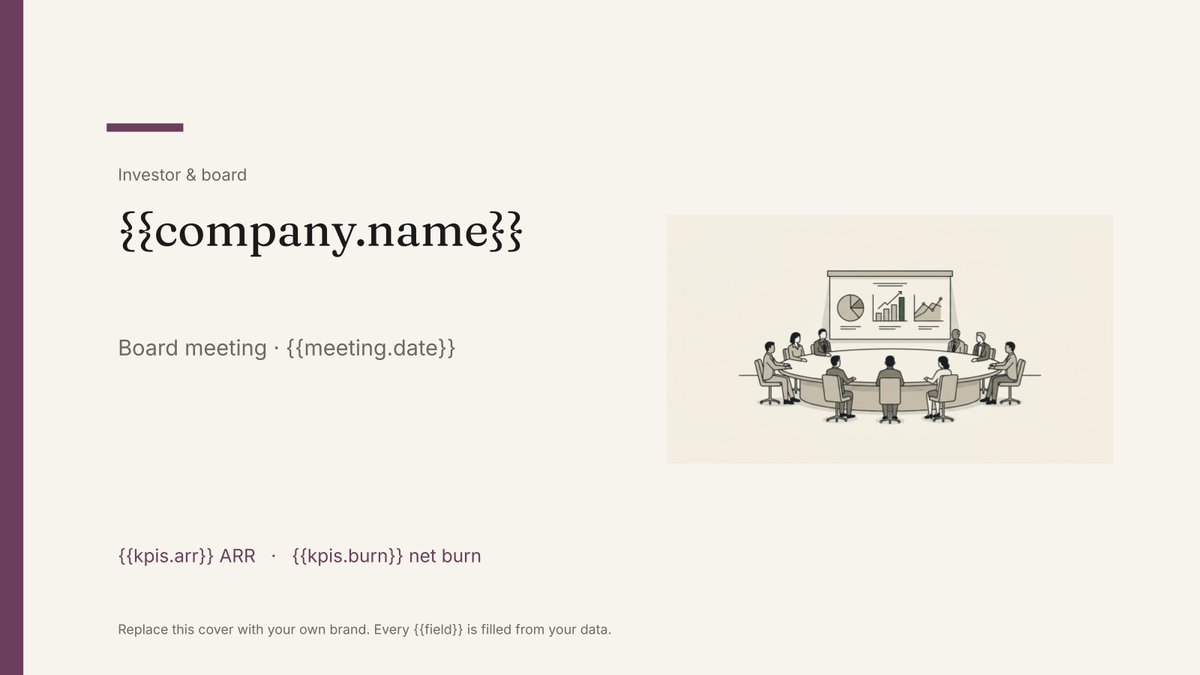 Google Slides
 Board deck template
The presented version of the board pack, built in Google Slides and generated each cycle from your KPI and financial data.
View templateCommon questions, answered
How is this different from a board report? +
Where do the metrics come from? +
Can I use my own investor update format? +
Can it go out on a schedule? +
How long should a monthly investor update be? +
Should I include lowlights or just highlights? +
Do I send the same update to every investor? +
Which KPIs belong in a monthly investor update? +
Generate this document from your data
Start on the free plan, connect a data source, and export a real Google Docs document. No watermark, no credit card.