Case study template
A customer story with challenge, approach and measured results, generated one per project from your delivery data.
Free plan, no credit card. Bring your own design or start from this layout.
What’s in this template
Every block is bound to a field in your data. The layout stays exactly as designed; only the values change from one run to the next.
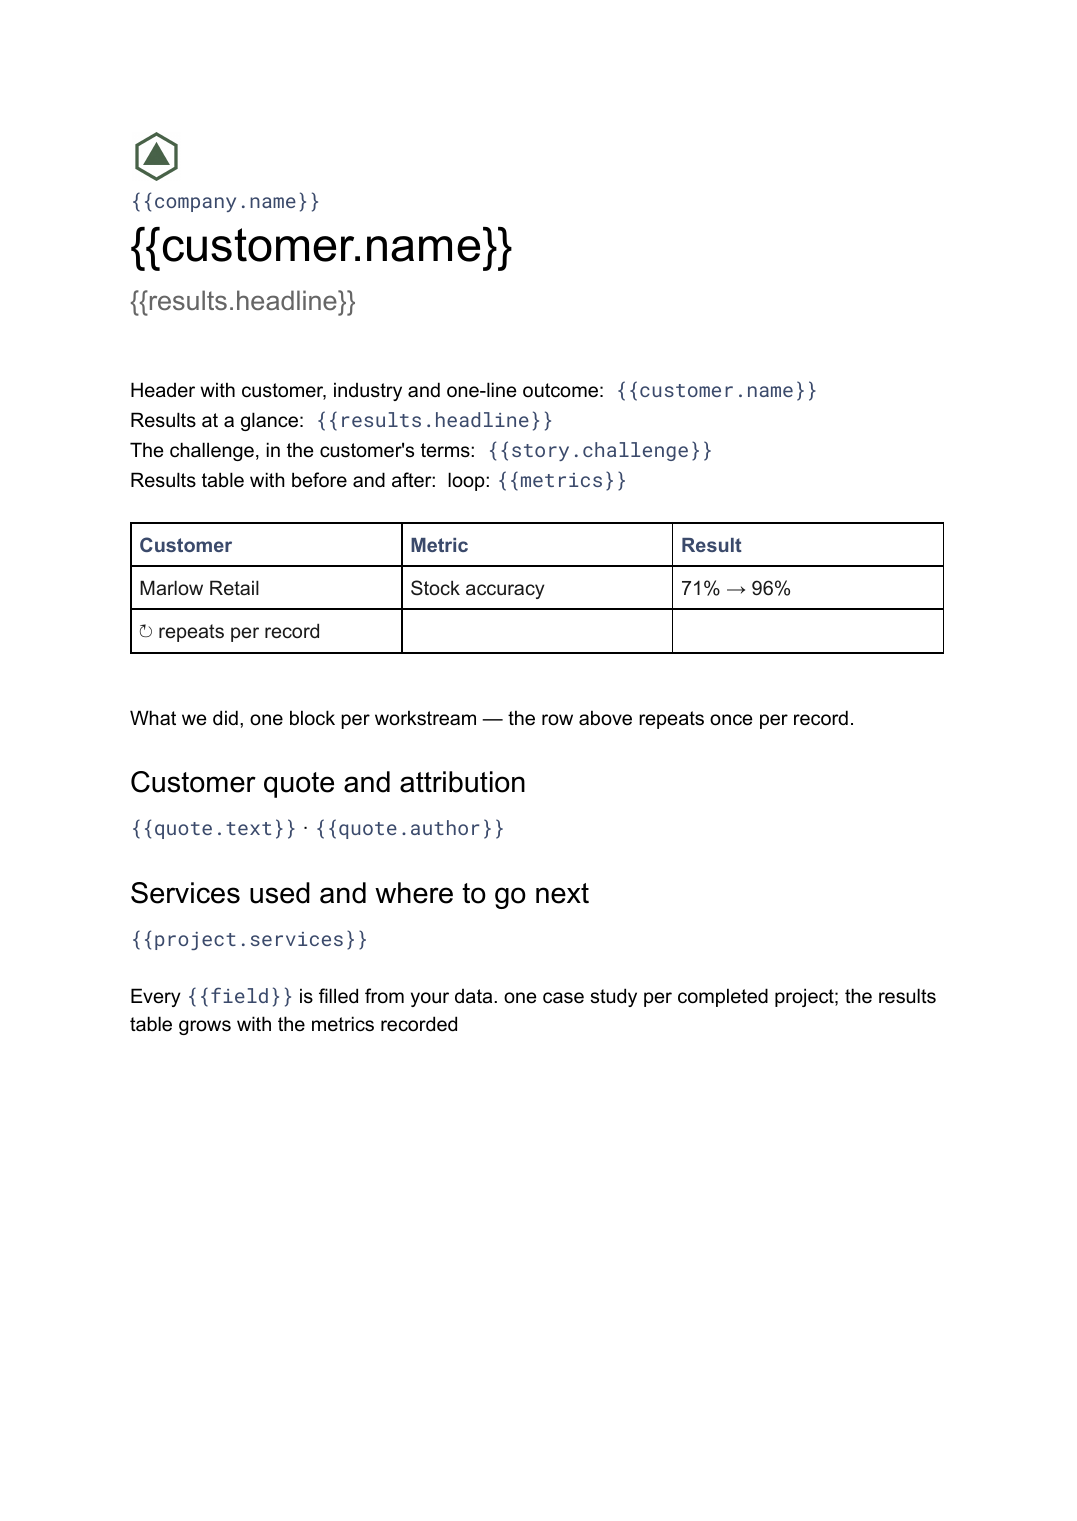
- Header with customer, industry and one-line outcome {{customer.name}}
- Results at a glance {{results.headline}}
- The challenge, in the customer's terms {{story.challenge}}
- What we did, one block per workstream loop: {{workstreams}}
- Results table with before and after loop: {{metrics}}
- Customer quote and attribution {{quote.text}} · {{quote.author}}
- Services used and where to go next {{project.services}}
How this template fills itself
Connect Airtable, Google Sheets, a SQL database, a CSV or a REST API, map each field to a placeholder, and generate. One run can produce a single document or one per matching record.
Projects · Airtable
Template: Google Slides or Docs
{{customer.name}}
{{results.headline}}
{{story.challenge}}
loop: {{metrics}} → row
{{quote.text}}
one case study per completed project; the results table grows with the metrics recorded
Generated output
DocsPDFMarlow Retail
Stock accuracy from 71% to 96% in one quarter
Shop-floor counts were three days behind the system
4 measured metrics
"We stopped guessing what was on the shelf."
Who uses this template
Agencies and consultancies
Turn finished projects into a written case study each, from the results you already recorded for the client.
Read the guideB2B marketing teams
Keep a library where every study has the same structure, so a reader can compare two of them without effort.
Read the guideCustomer success teams
Write up an account's outcomes from the metrics in your reporting data rather than reconstructing them months later.
Read the guideA case study is the document most companies mean to write and rarely do, because by the time a project ends the numbers have been filed somewhere and the person who knew the story has moved on. The format is a Google Doc because the length genuinely varies: some projects have three measured results and a paragraph, others have ten and a page of context, and the pages should break themselves either way.
Record the results as data, not prose
The difference between a case-study library and a folder of stray documents is whether the outcomes are stored as fields. Put the metric name, the before value, the after value and the period in your project table while the work is still fresh, and the results table writes itself later. The narrative parts — challenge, approach, quote — sit in the same record as written text. Then a study is a run rather than a project, and every study in the library is structured the same way, which is what lets a reader compare two of them at a glance.
Related templates
All sales & pricing →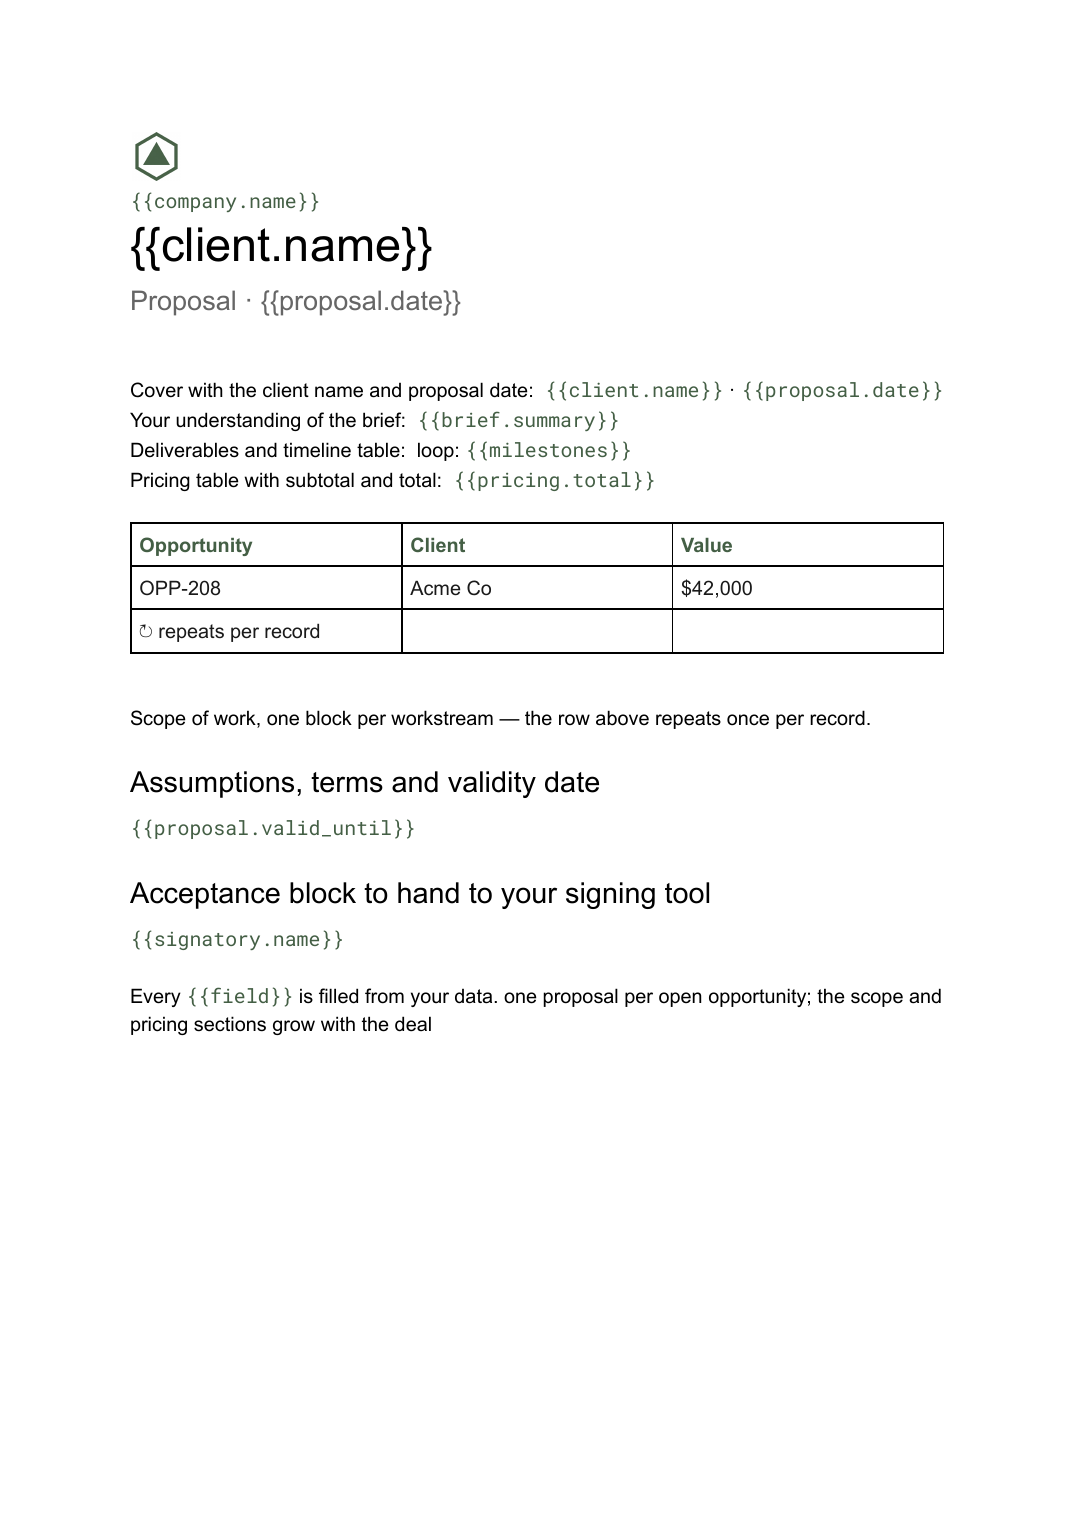 Google Docs
 Business proposal template for Google Docs
A client-facing proposal with scope, deliverables and pricing, generated one per opportunity from your deal data.
View template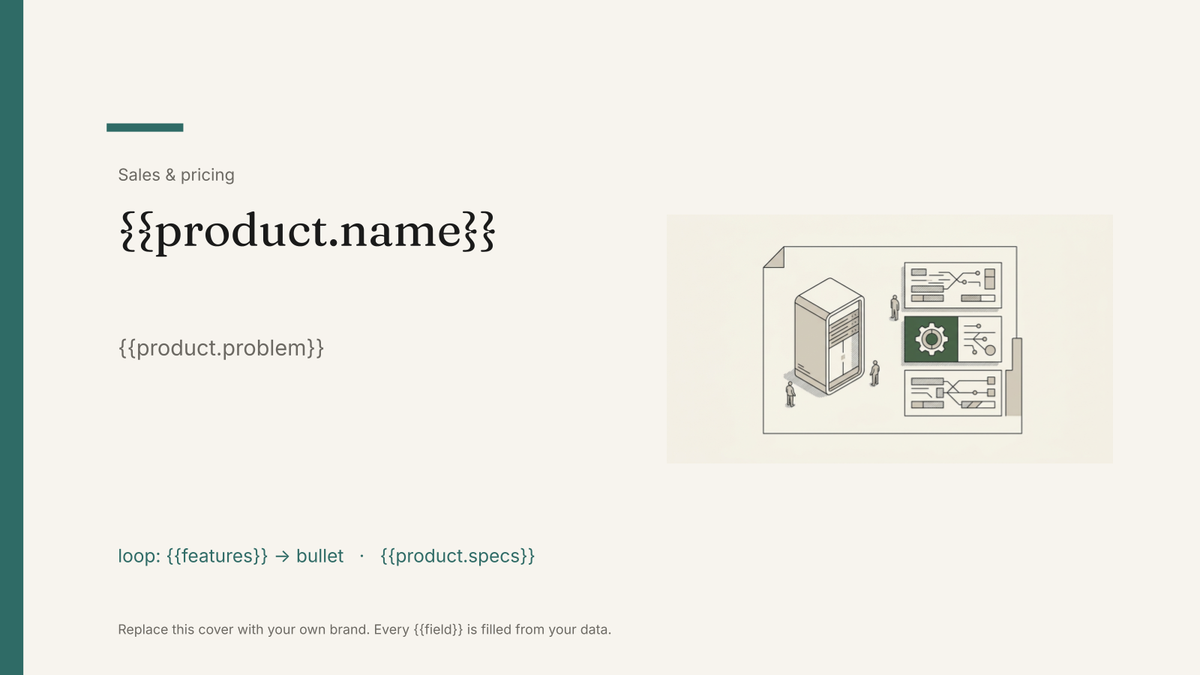 Google Slides
 Product one-pager template
A single-page product summary with positioning, features and pricing, generated one per product from your catalogue.
View template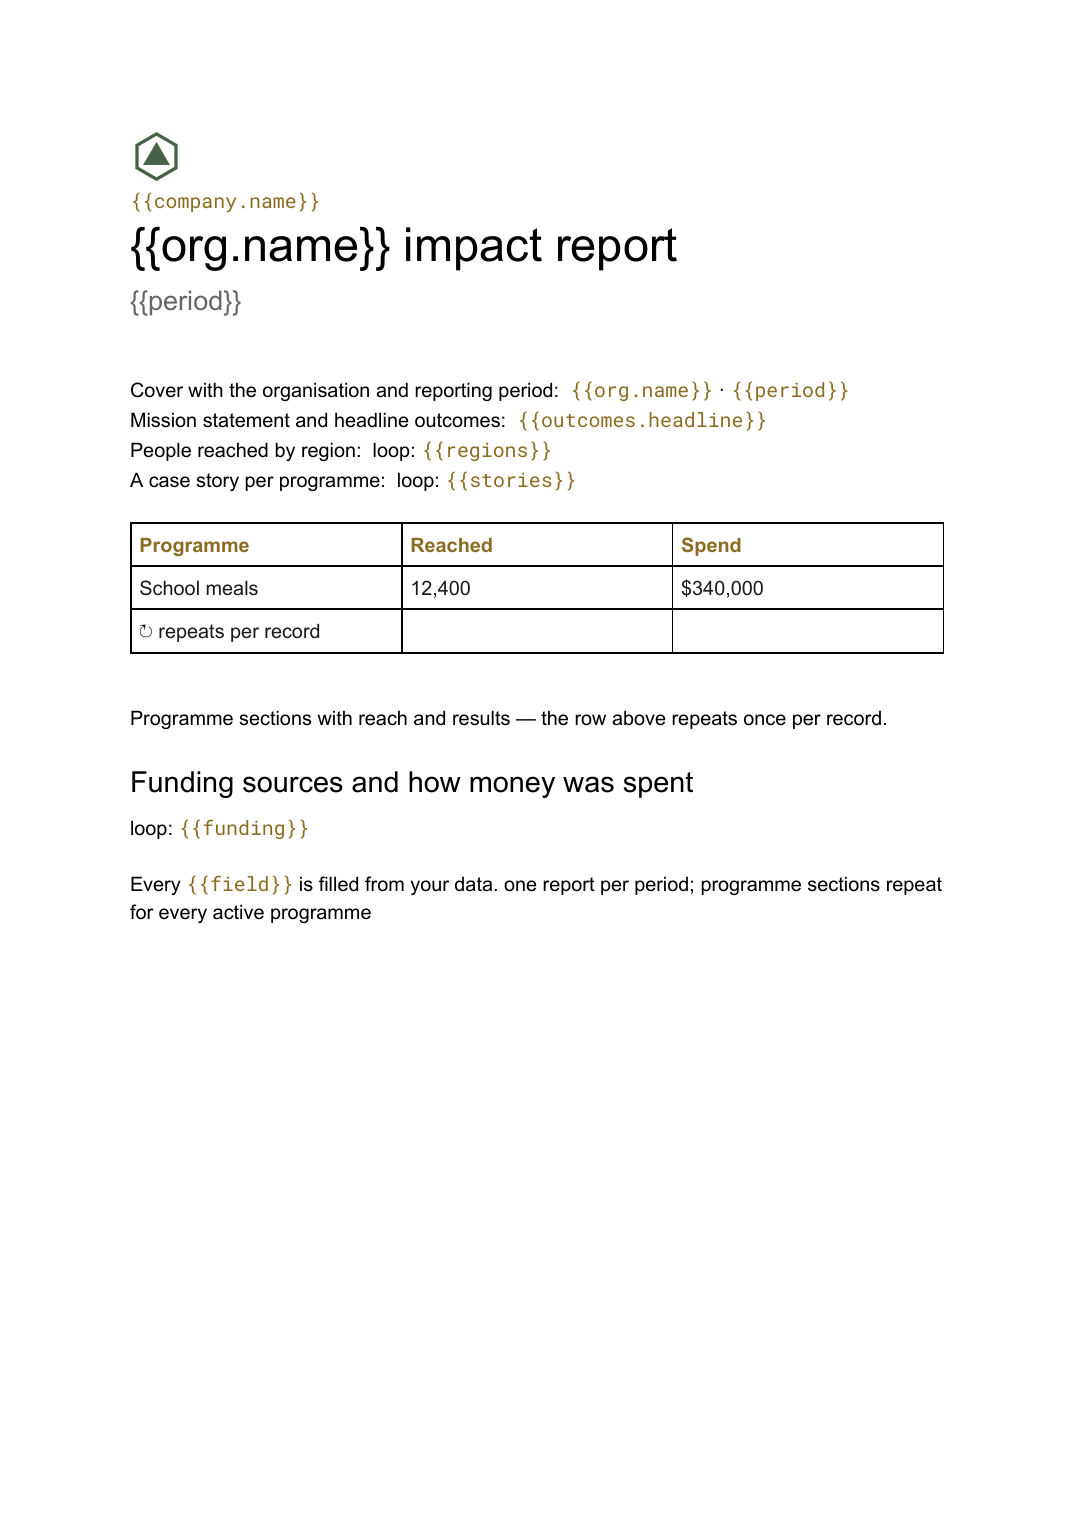 Google Docs
 Impact report template
A programme-by-programme account of outcomes and reach, generated from the monitoring data your team already collects.
View template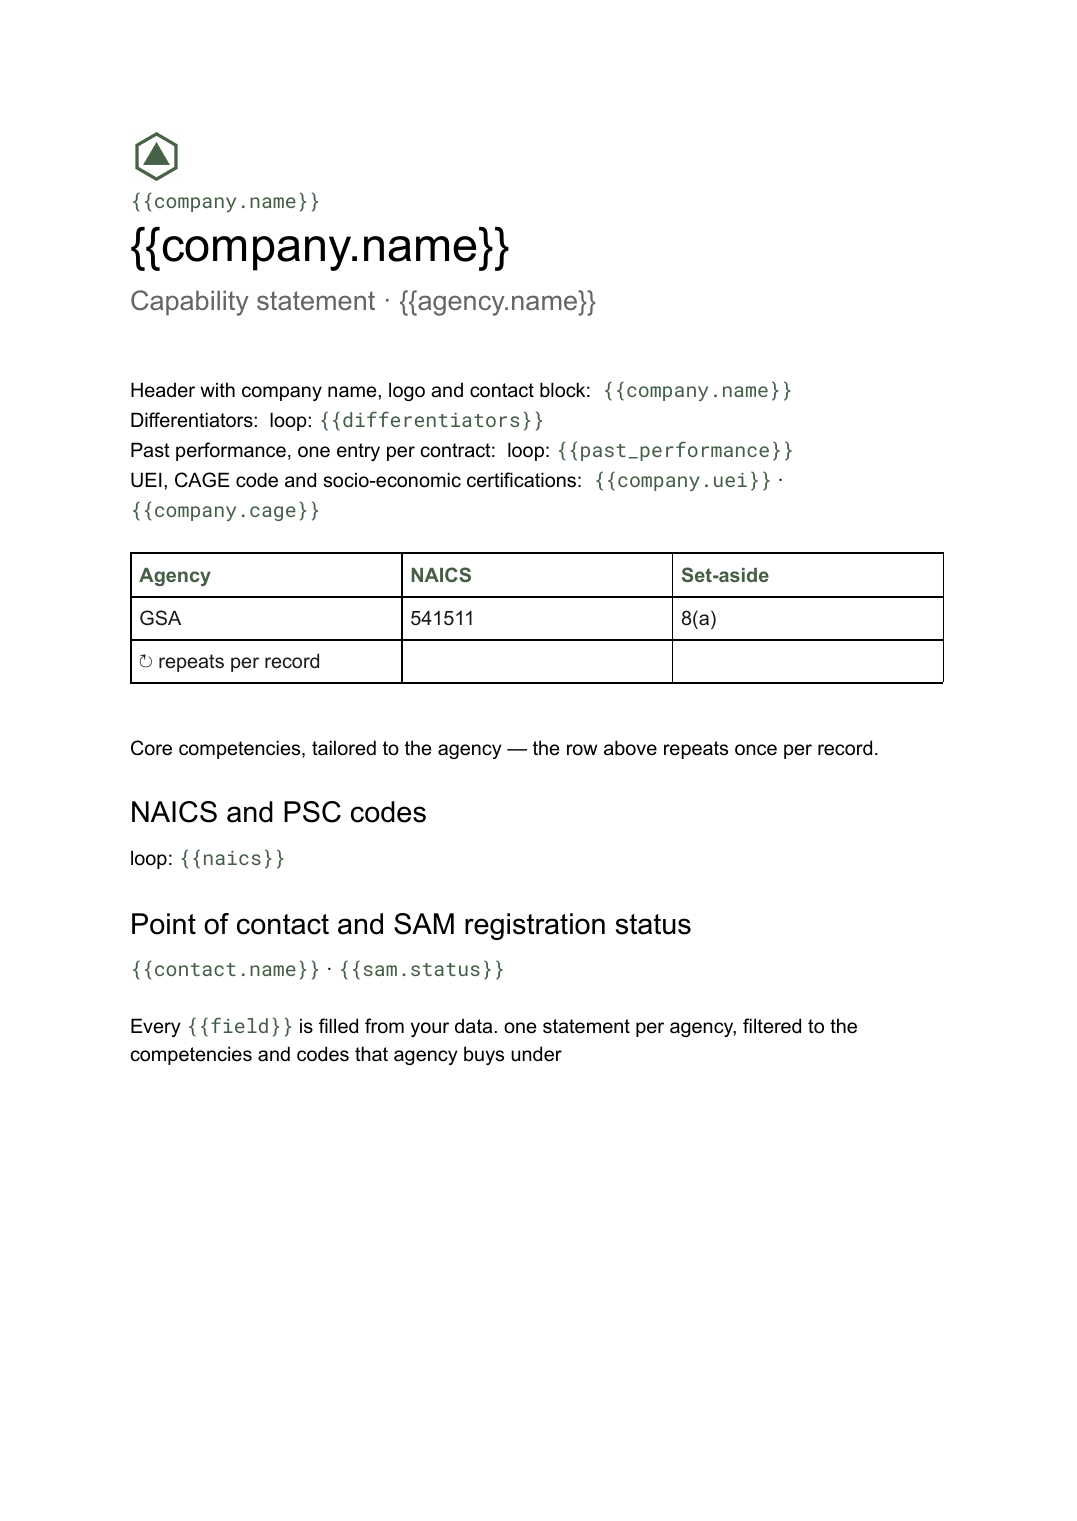 Google Docs
 Capability statement template
A one-page government contracting summary with core competencies, codes and past performance, generated from one company record.
View templateCommon questions, answered
Can I use my own case study design? +
Isn't the writing the whole point of a case study? +
Where do the results come from? +
Can I generate a batch of case studies? +
Generate this document from your data
Start on the free plan, connect a data source, and export a real Google Docs document. No watermark, no credit card.