Comparative market analysis template
A priced comparison of a subject property against recent comparable sales, generated per property from your sales data.
Free plan, no credit card. Bring your own design or start from this layout.
What’s in this template
Every block is bound to a field in your data. The layout stays exactly as designed; only the values change from one run to the next.
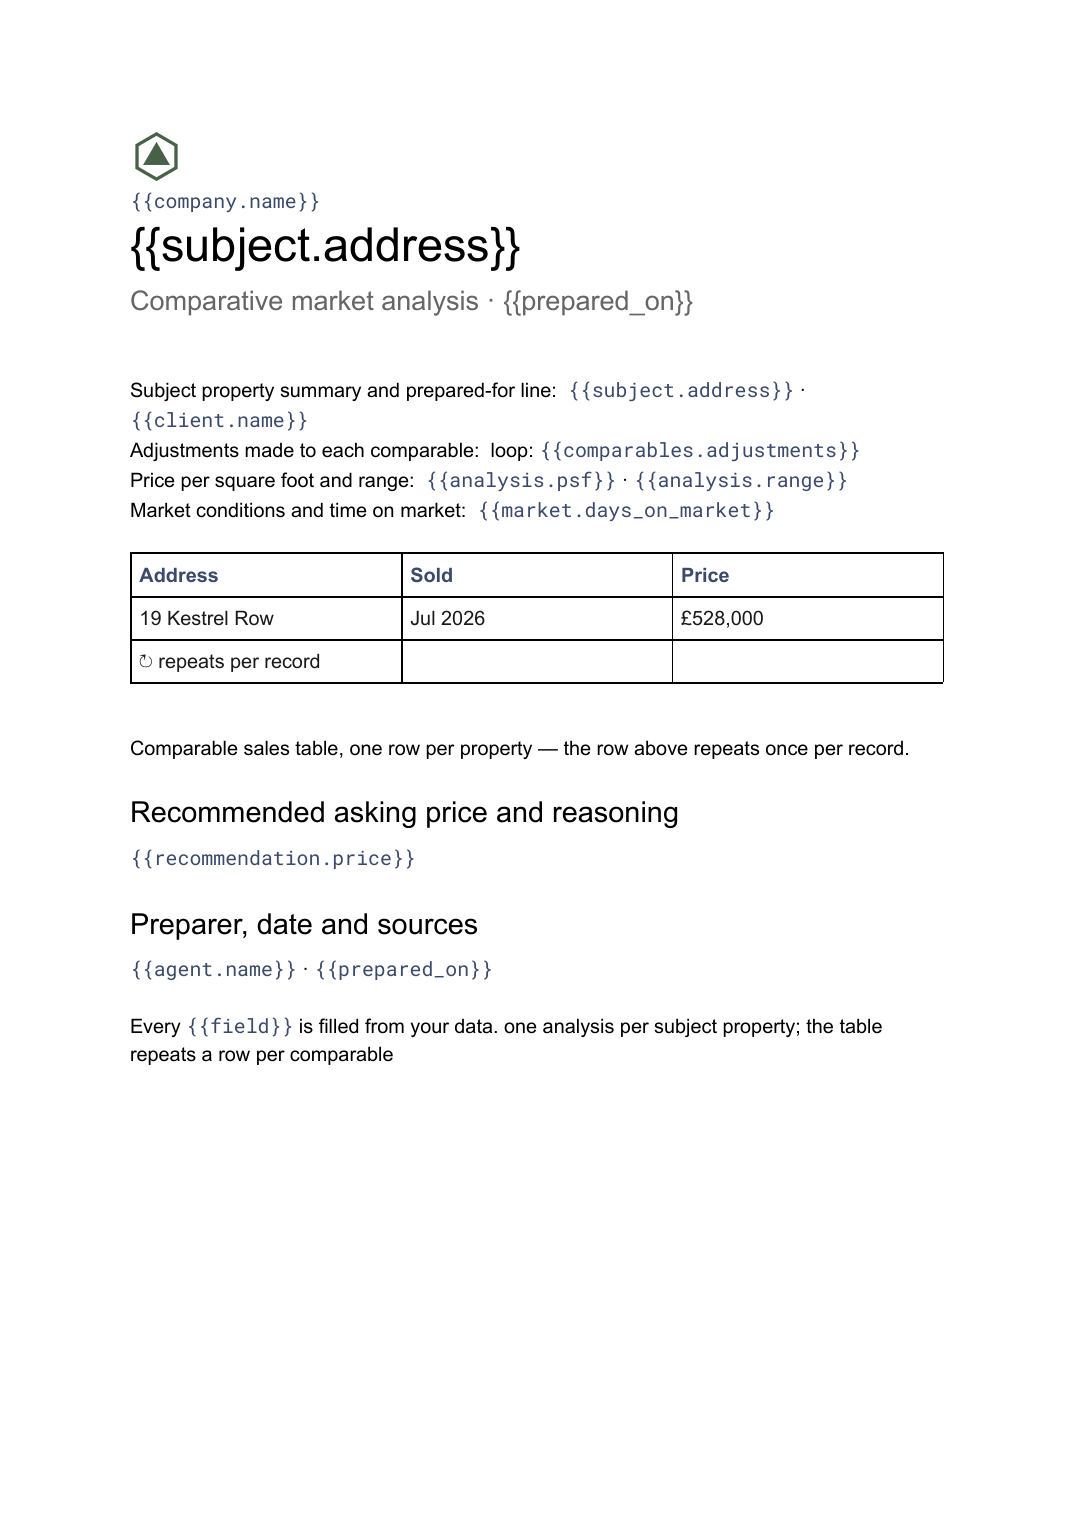
- Subject property summary and prepared-for line {{subject.address}} · {{client.name}}
- Comparable sales table, one row per property loop: {{comparables}}
- Adjustments made to each comparable loop: {{comparables.adjustments}}
- Price per square foot and range {{analysis.psf}} · {{analysis.range}}
- Market conditions and time on market {{market.days_on_market}}
- Recommended asking price and reasoning {{recommendation.price}}
- Preparer, date and sources {{agent.name}} · {{prepared_on}}
How this template fills itself
Connect Airtable, Google Sheets, a SQL database, a CSV or a REST API, map each field to a placeholder, and generate. One run can produce a single document or one per matching record.
Comparable sales · SQL database
Template: Google Slides or Docs
{{subject.address}}
Comparative market analysis · {{prepared_on}}
loop: {{comparables}} → row
{{analysis.range}} range
{{recommendation.price}} recommended
one analysis per subject property; the table repeats a row per comparable
Generated output
DocsPDF22 Kestrel Row
Comparative market analysis · 4 Sep 2026
6 comparables listed
£505,000–£555,000 range
£540,000 recommended
Who uses this template
Listing agents
Back a suggested asking price with the sales that support it, prepared before the valuation appointment.
Read the guideBrokerage and valuation teams
Keep every analysis in the same structure so two agents pricing similar homes show their working the same way.
Read the guideInvestors and buying agents
Produce a written comparison per property under consideration from the sales data you already pull.
Read the guideA comparative market analysis argues a price. It puts a subject property next to recent sales that are genuinely like it, shows the adjustments made for size, condition and date, and lands on a recommended figure a seller can follow. The evidence is the document, so its length depends on how many comparables the market gives you, which is what Docs handles and a fixed slide layout does not.
Choosing the comparables in the data
The selection rules belong in the query, not in the writing. Set the radius, the property type, the size band and how far back a sale still counts, then let the run pull whatever matches and repeat a row for each. When a property has too few comparables the document shows that rather than hiding it behind three cherry-picked sales. Keep the adjustment for each comparable in a field beside it, so the reasoning travels with the number and the same house priced twice gives the same answer.
Related templates
All real estate → Google Slides
 Listing presentation template
The pitch deck an agent shows a seller to win the instruction, generated one per appointment from your listings and sales data.
View template Google Slides
 Real estate brochure template
A buyer-facing brochure for a single listing, generated one per property from your listings data.
View template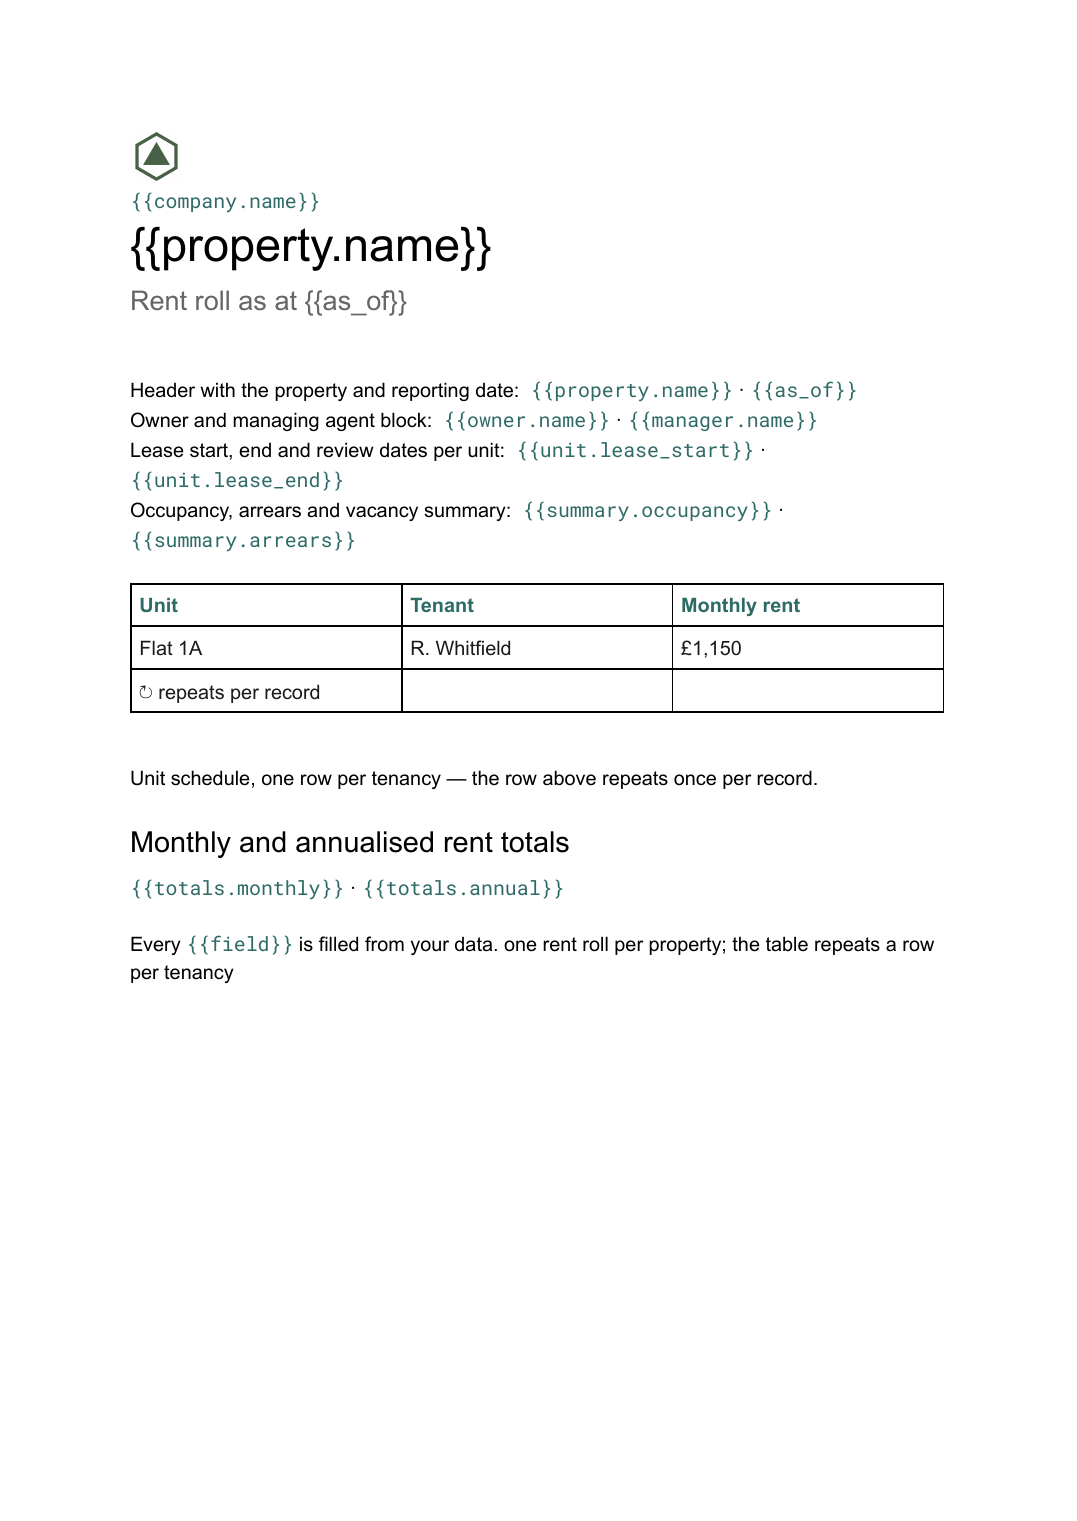 Google Docs
 Rent roll template for Google Docs
A schedule of units, tenants, rents and lease dates with totals, generated per property or portfolio from your tenancy data.
View template Google Slides
 Open house flyer template
A one-page handout for a specific viewing, generated one per open house from your listings and event data.
View templateCommon questions, answered
Why is a CMA a Google Doc rather than a deck? +
Where do the comparable sales come from? +
Can I use our own CMA format? +
Can I prepare an analysis for several properties in one run? +
Generate this document from your data
Start on the free plan, connect a data source, and export a real Google Docs document. No watermark, no credit card.