Project status report template
A per-project status write-up covering progress, milestones, risks and open actions, generated one per project from your tracker.
Free plan, no credit card. Bring your own design or start from this layout.
What’s in this template
Every block is bound to a field in your data. The layout stays exactly as designed; only the values change from one run to the next.
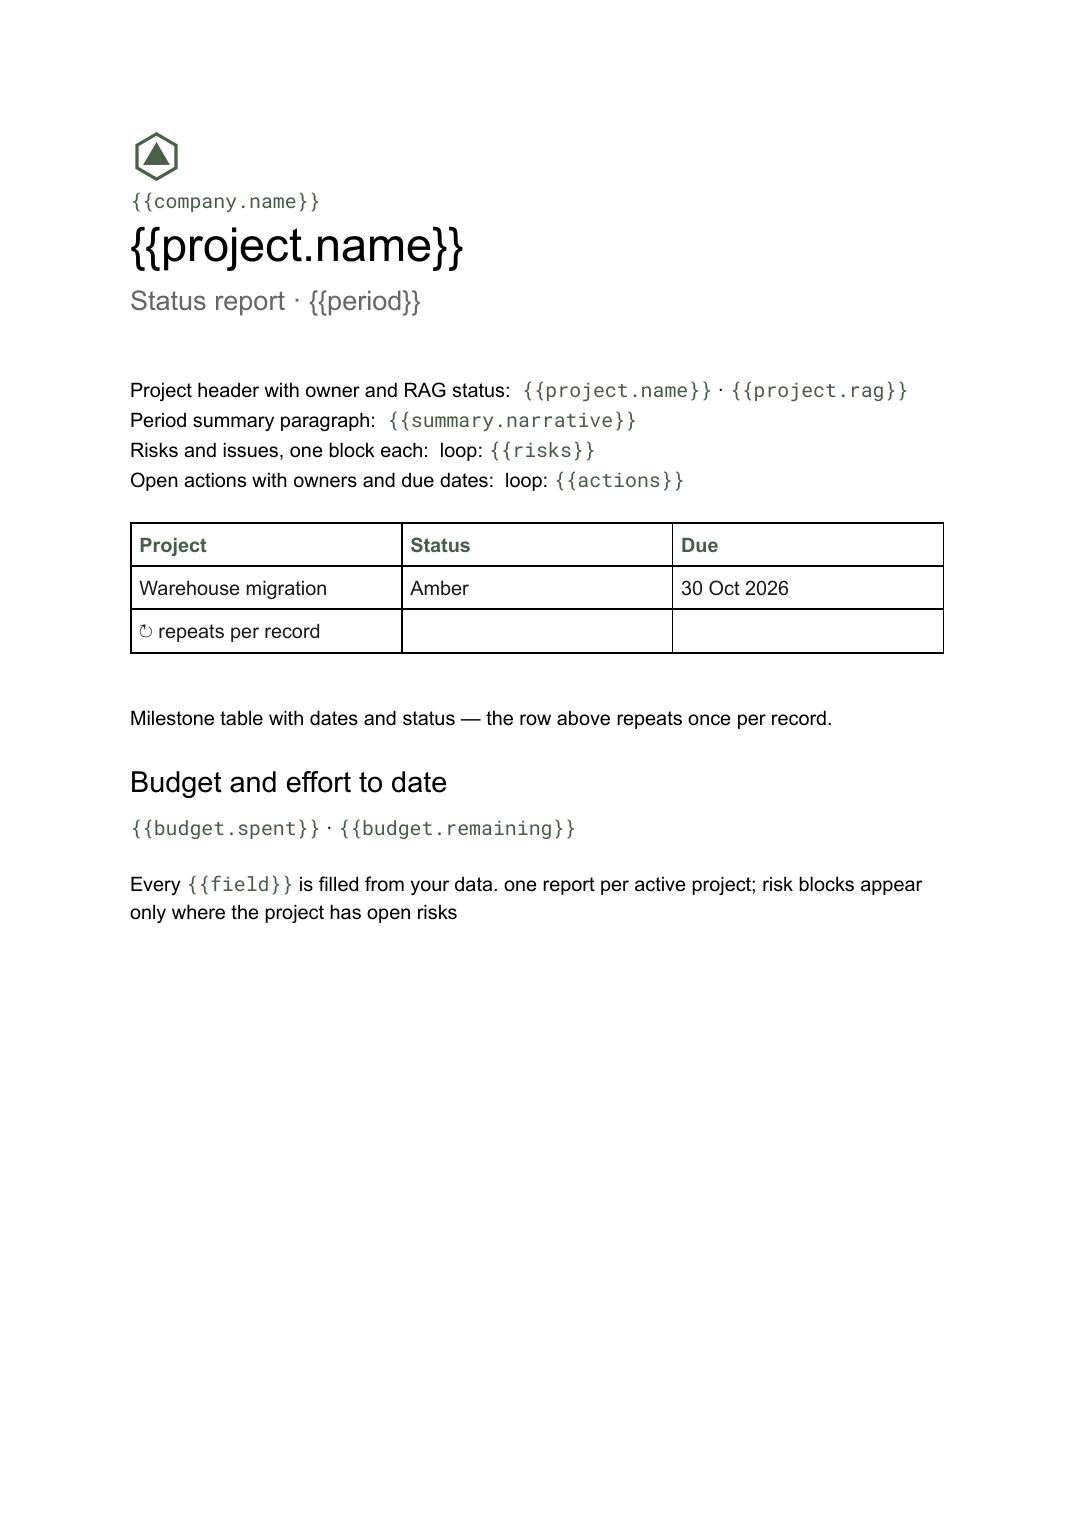
- Project header with owner and RAG status {{project.name}} · {{project.rag}}
- Period summary paragraph {{summary.narrative}}
- Milestone table with dates and status loop: {{milestones}}
- Risks and issues, one block each loop: {{risks}}
- Open actions with owners and due dates loop: {{actions}}
- Budget and effort to date {{budget.spent}} · {{budget.remaining}}
How this template fills itself
Connect Airtable, Google Sheets, a SQL database, a CSV or a REST API, map each field to a placeholder, and generate. One run can produce a single document or one per matching record.
Projects · Airtable
Template: Google Slides or Docs
{{project.name}}
Status report · {{period}}
Status {{project.rag}}
loop: {{milestones}} → table row
loop: {{risks}} → risk block
one report per active project; risk blocks appear only where the project has open risks
Generated output
DocsPDFWarehouse migration
Status report · week 36
Status Amber
7 milestones, 2 slipped
3 open risks
Who uses this template
PMOs and delivery leads
Produce a report for every live project on the same cycle, from the tracker the projects already update.
Read the guideConsultancies
Give each client a written status document in your format rather than a screenshot of your internal board.
Read the guideOperations teams
Keep a dated record of where each initiative stood, which a live dashboard cannot give you later.
Read the guideA project status report exists so that people who are not in the project can tell whether it is fine. That makes it a written document rather than a designed one: the milestone table is long on some projects and short on others, and a project with six open risks needs six blocks, not a slide that fits four.
Let the exceptions decide the length
The useful trick with generated status reports is to bind the risk and action blocks to filtered subsets rather than the whole register. A green project with nothing open then produces a short, honest page instead of three pages of closed items, and an amber one expands to explain itself. That contrast does real work in a governance pack, because the reader sees which projects need attention from the shape of the document before reading a word. It also removes the temptation to prune the report by hand, which is where status reporting quietly stops being trustworthy.
Related templates
All reports →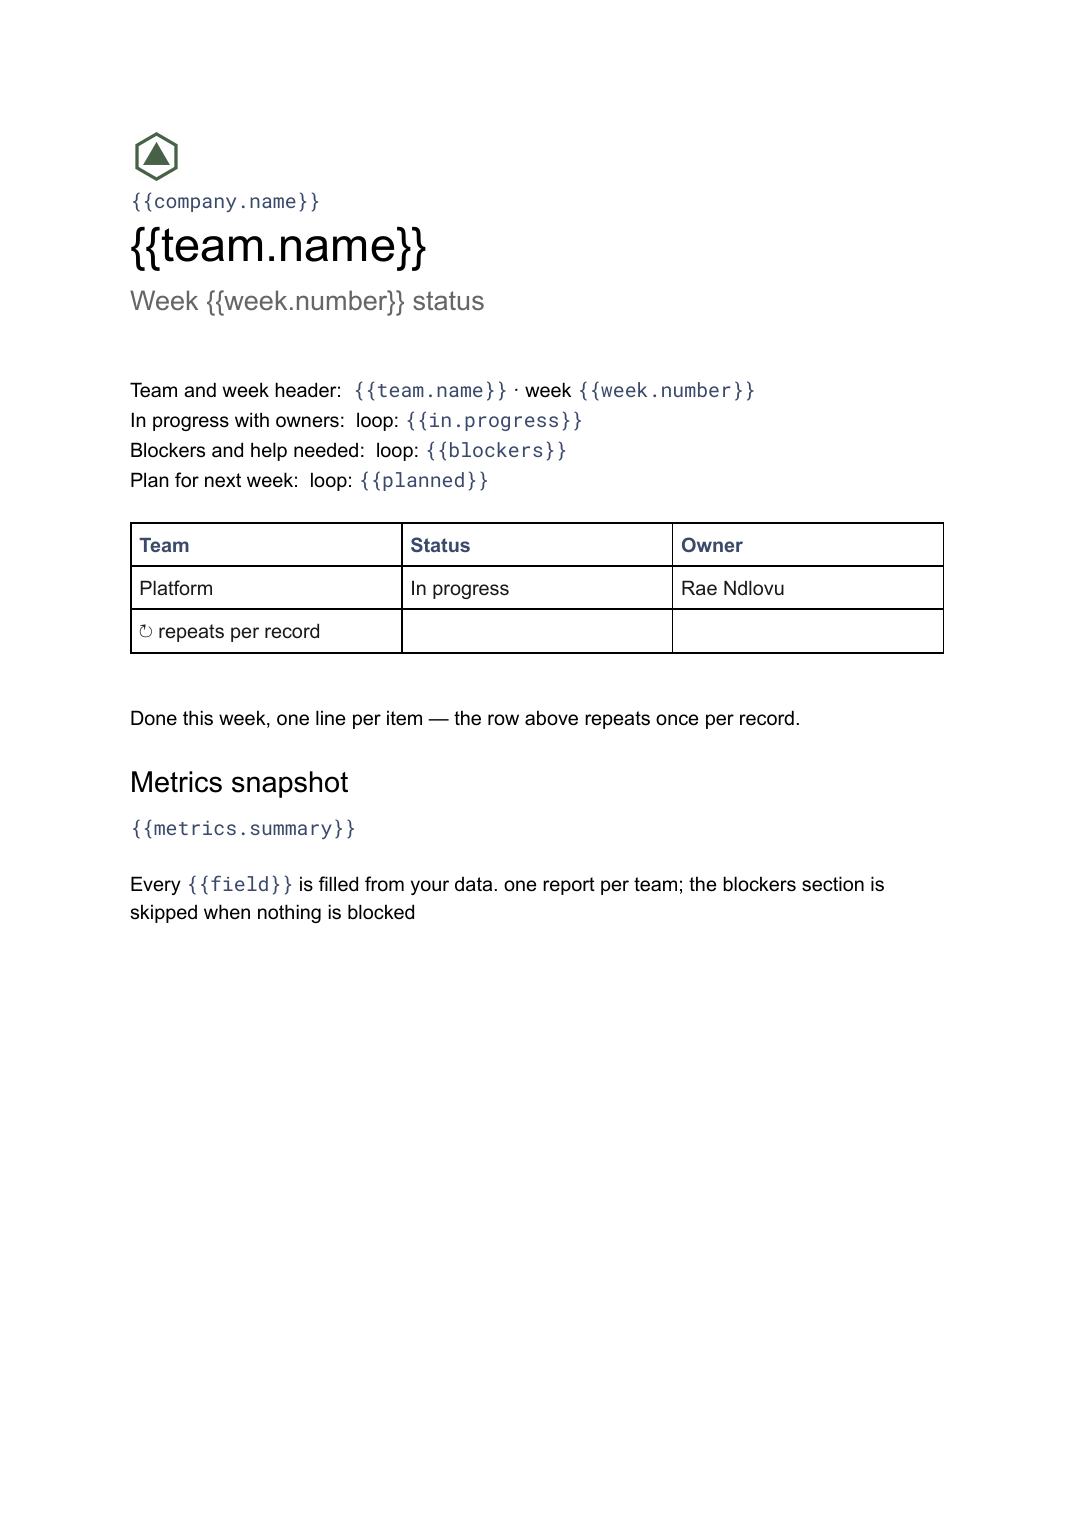 Google Docs
 Weekly status report template
A short weekly write-up of progress, blockers and next steps, generated one per team or project from your task tracker.
View template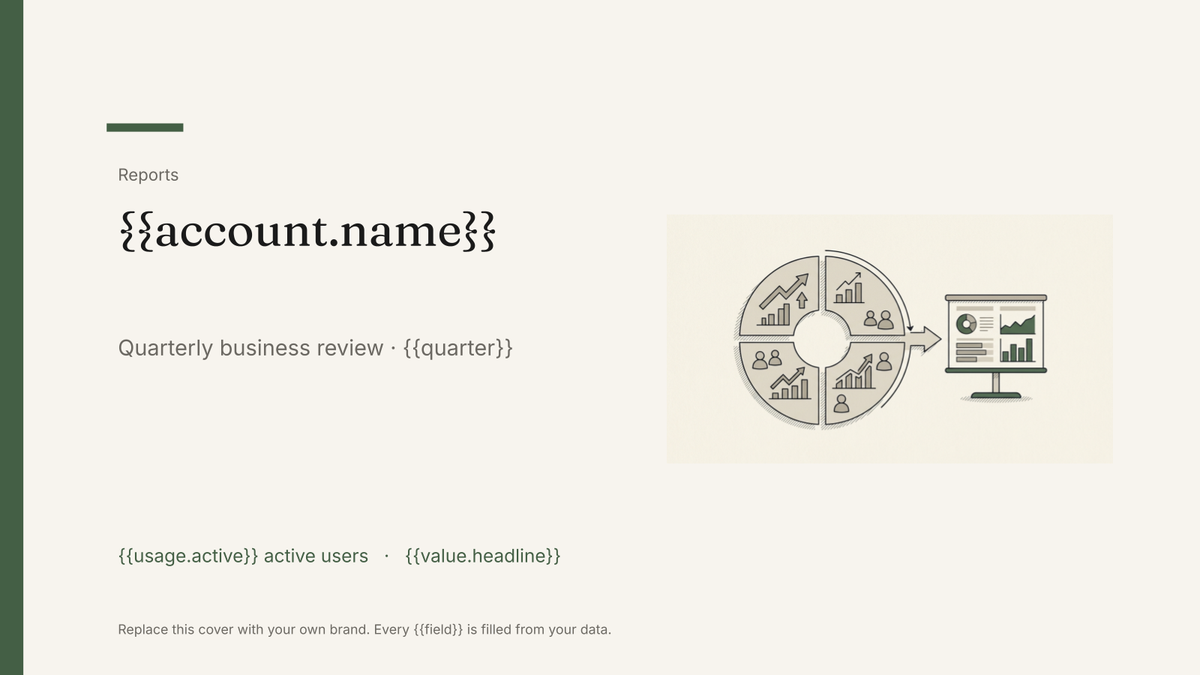 Google Slides
 QBR deck template
A quarterly business review deck covering value delivered, adoption and next-quarter plans, generated one per account from your customer data.
View template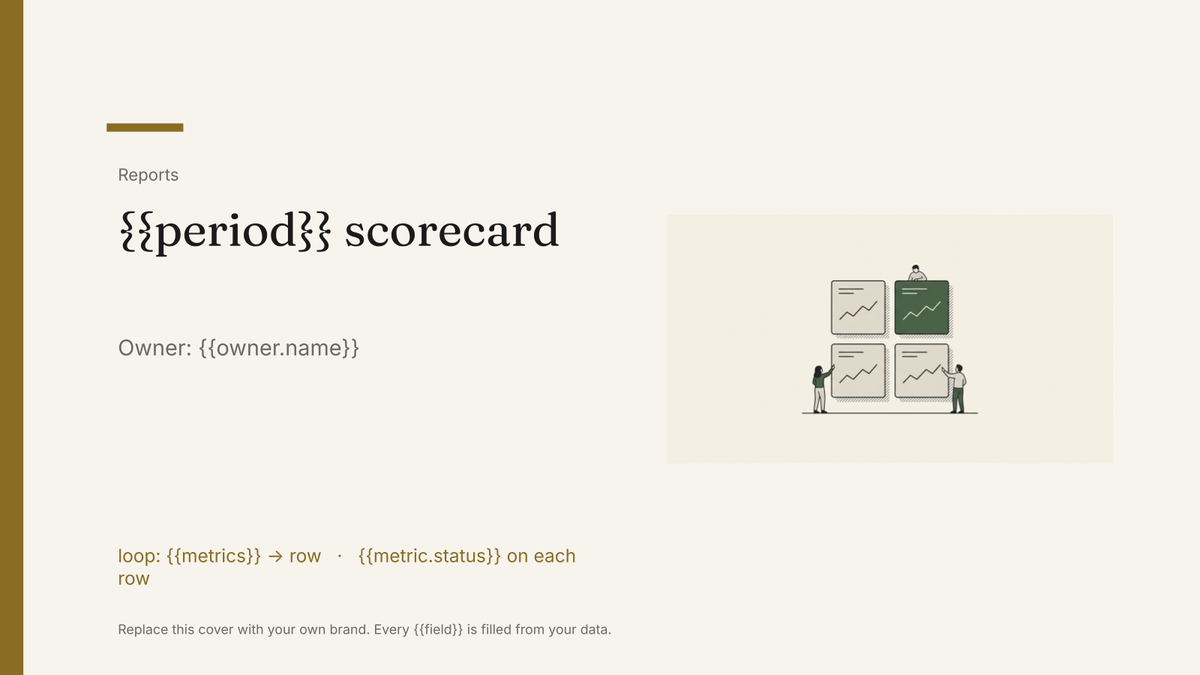 Google Slides
 KPI scorecard template
A one-page KPI scorecard showing target, actual and variance per metric, generated each period from your reporting data.
View template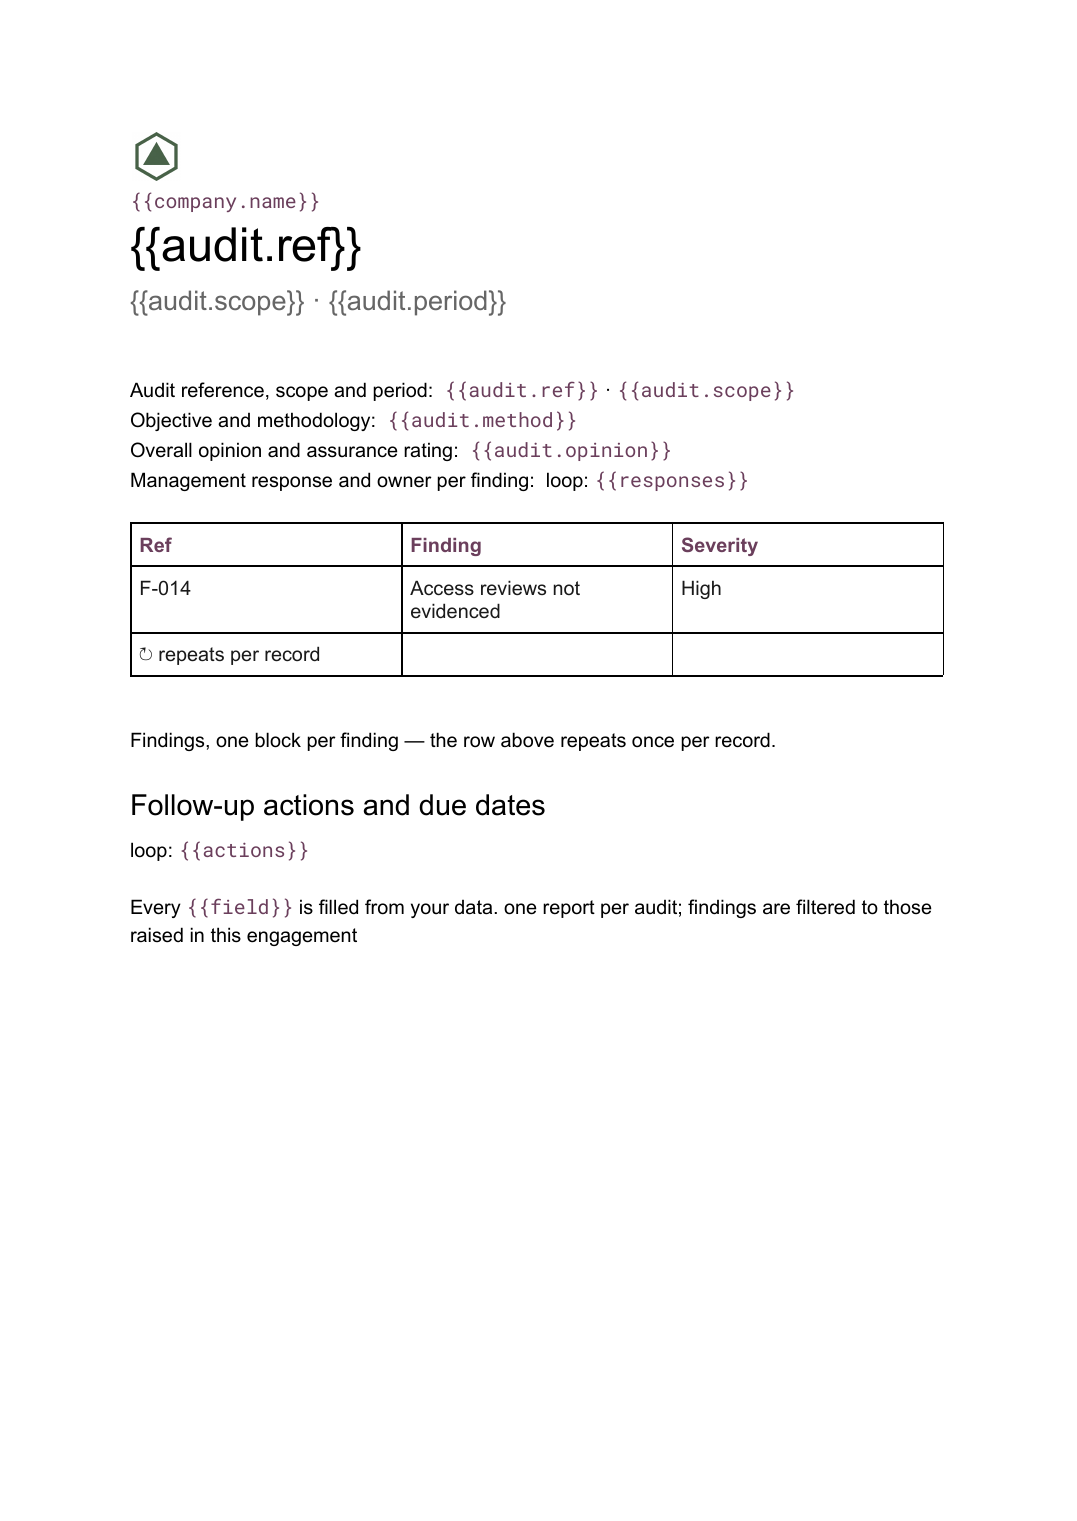 Google Docs
 Audit report template
A per-audit report setting out scope, findings with severity and management responses, generated from your findings register.
View templateCommon questions, answered
How is this different from the dashboard we already have? +
Where do the milestones, risks and actions come from? +
Can I generate a report for every project at once? +
Can I use our own status report format? +
Generate this document from your data
Start on the free plan, connect a data source, and export a real Google Docs document. No watermark, no credit card.