Social media report template
A per-channel social performance report with reach, engagement and top-post blocks, generated one per account from your platform data.
Free plan, no credit card. Bring your own design or start from this layout.
What’s in this template
Every block is bound to a field in your data. The layout stays exactly as designed; only the values change from one run to the next.
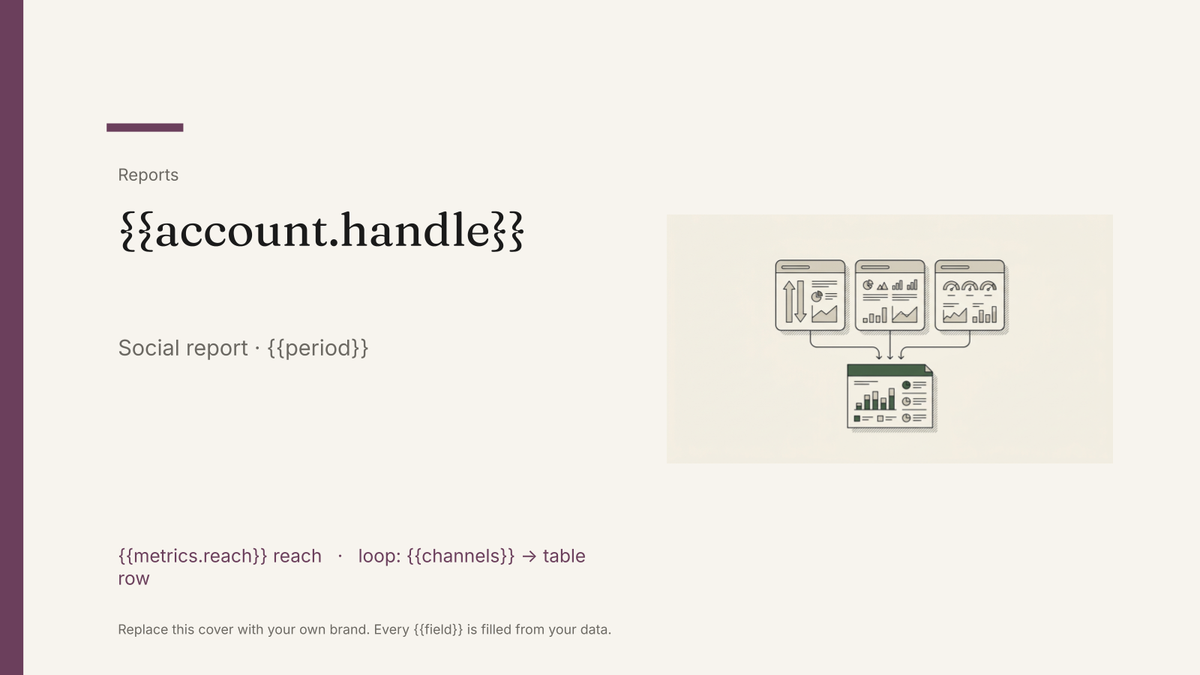
- Cover with the account handle and period {{account.handle}} · {{period}}
- Follower and reach headline tiles {{metrics.reach}} · {{metrics.followers}}
- Channel breakdown, one row per platform loop: {{channels}}
- Top posts with their headline stats loop: {{posts.top}}
- Audience and posting-time notes {{notes.audience}}
- Content plan for the next period {{plan.content}}
How this template fills itself
Connect Airtable, Google Sheets, a SQL database, a CSV or a REST API, map each field to a placeholder, and generate. One run can produce a single document or one per matching record.
Channels · Airtable
Template: Google Slides or Docs
{{account.handle}}
Social report · {{period}}
{{metrics.reach}} reach
loop: {{channels}} → table row
loop: {{posts.top}} → post block
one report per account; the top-post loop is filtered to the five best by engagement
Generated output
SlidesPDF@acmeco
Social report · August 2026
261,900 reach
3 channels
5 top posts
Who uses this template
Social and content agencies
Report on every client handle on the same monthly cycle, each in that client's brand.
Read the guideCommunity and social managers
Turn the platform exports you already download into a report a manager can read without a login.
Read the guideBrand marketing teams
Compare channels side by side in a fixed layout instead of stitching screenshots from four dashboards.
Read the guideA social media report is mostly a comparison: this period against the last, and each channel against the others. Native platform exports refuse to do that — they arrive one platform at a time, in four different shapes — so the work is really consolidation, and it is the same work every month.
Store one row per channel per period
Almost every problem with social reporting comes from the data being stored as monthly exports rather than as records. Keep a single table where each row is one channel in one period, with reach, engagements, followers and spend as columns, and the report becomes trivial: the channel loop prints the rows for the period, and the same table can answer next quarter’s questions too. Top posts sit in a second table linked to the account. Once the data is shaped that way, a run produces every client’s report at once and the numbers on the slide can always be traced back to a row.
Related templates
All reports →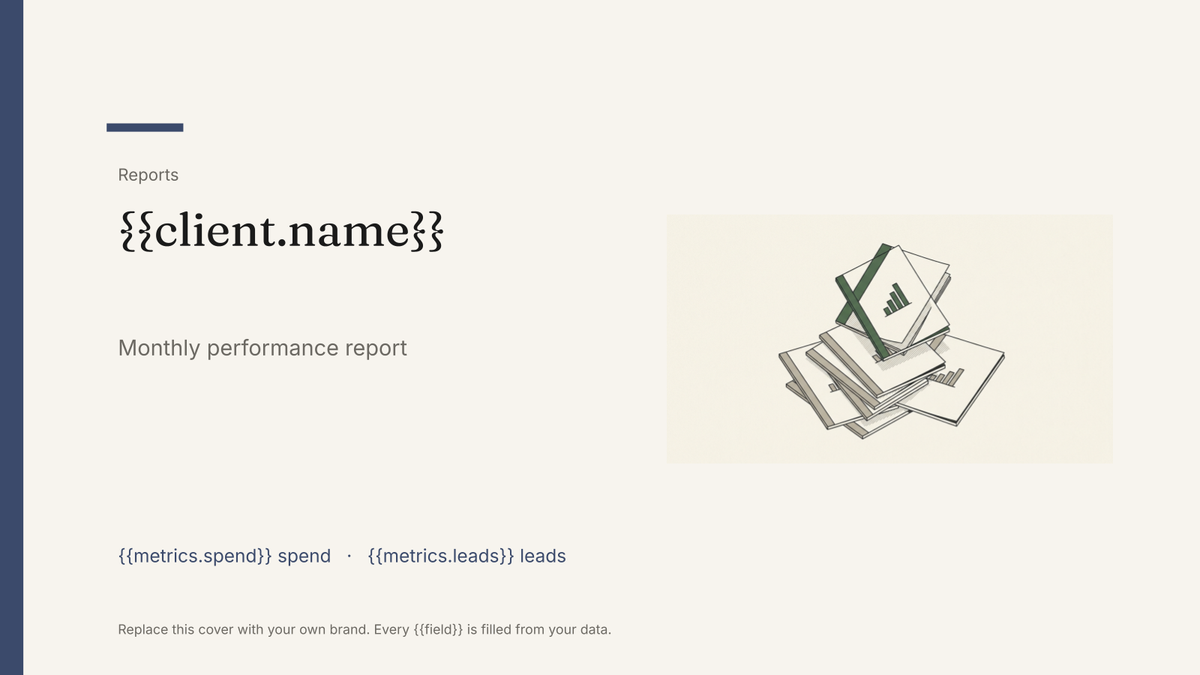 Google Slides
 Agency client report template
A white-label monthly performance report, generated one per client account from your campaign data.
View template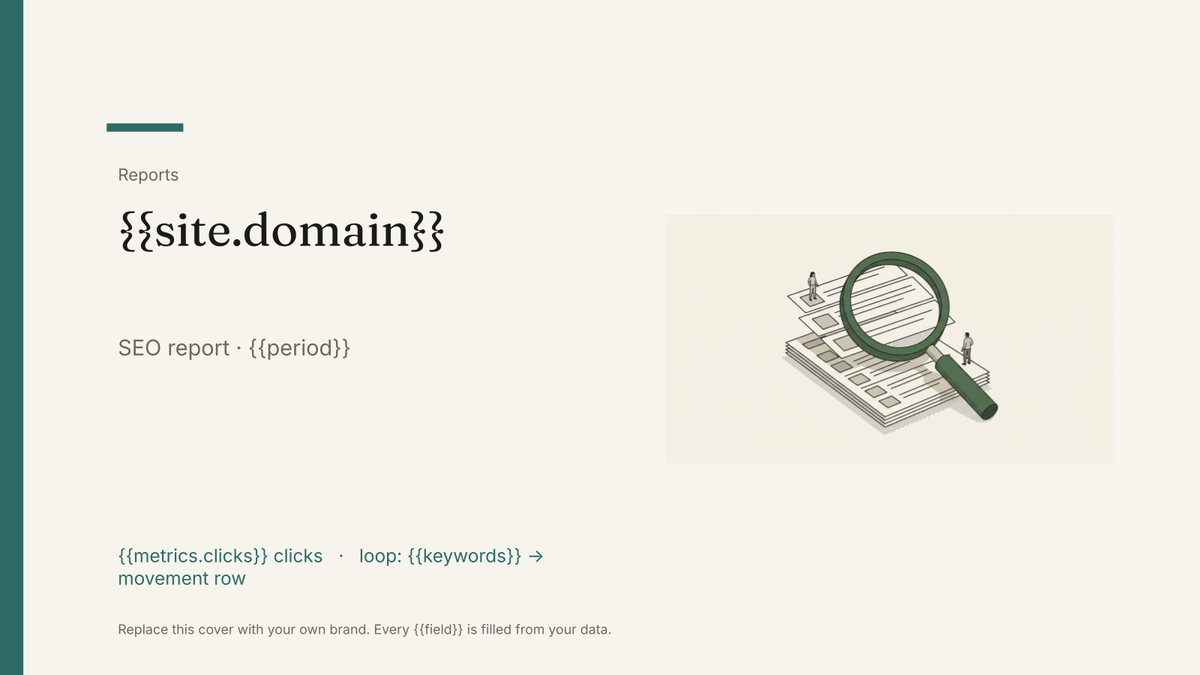 Google Slides
 SEO report template
A monthly search performance report with ranking, traffic and technical blocks, generated one per site from your SEO data.
View template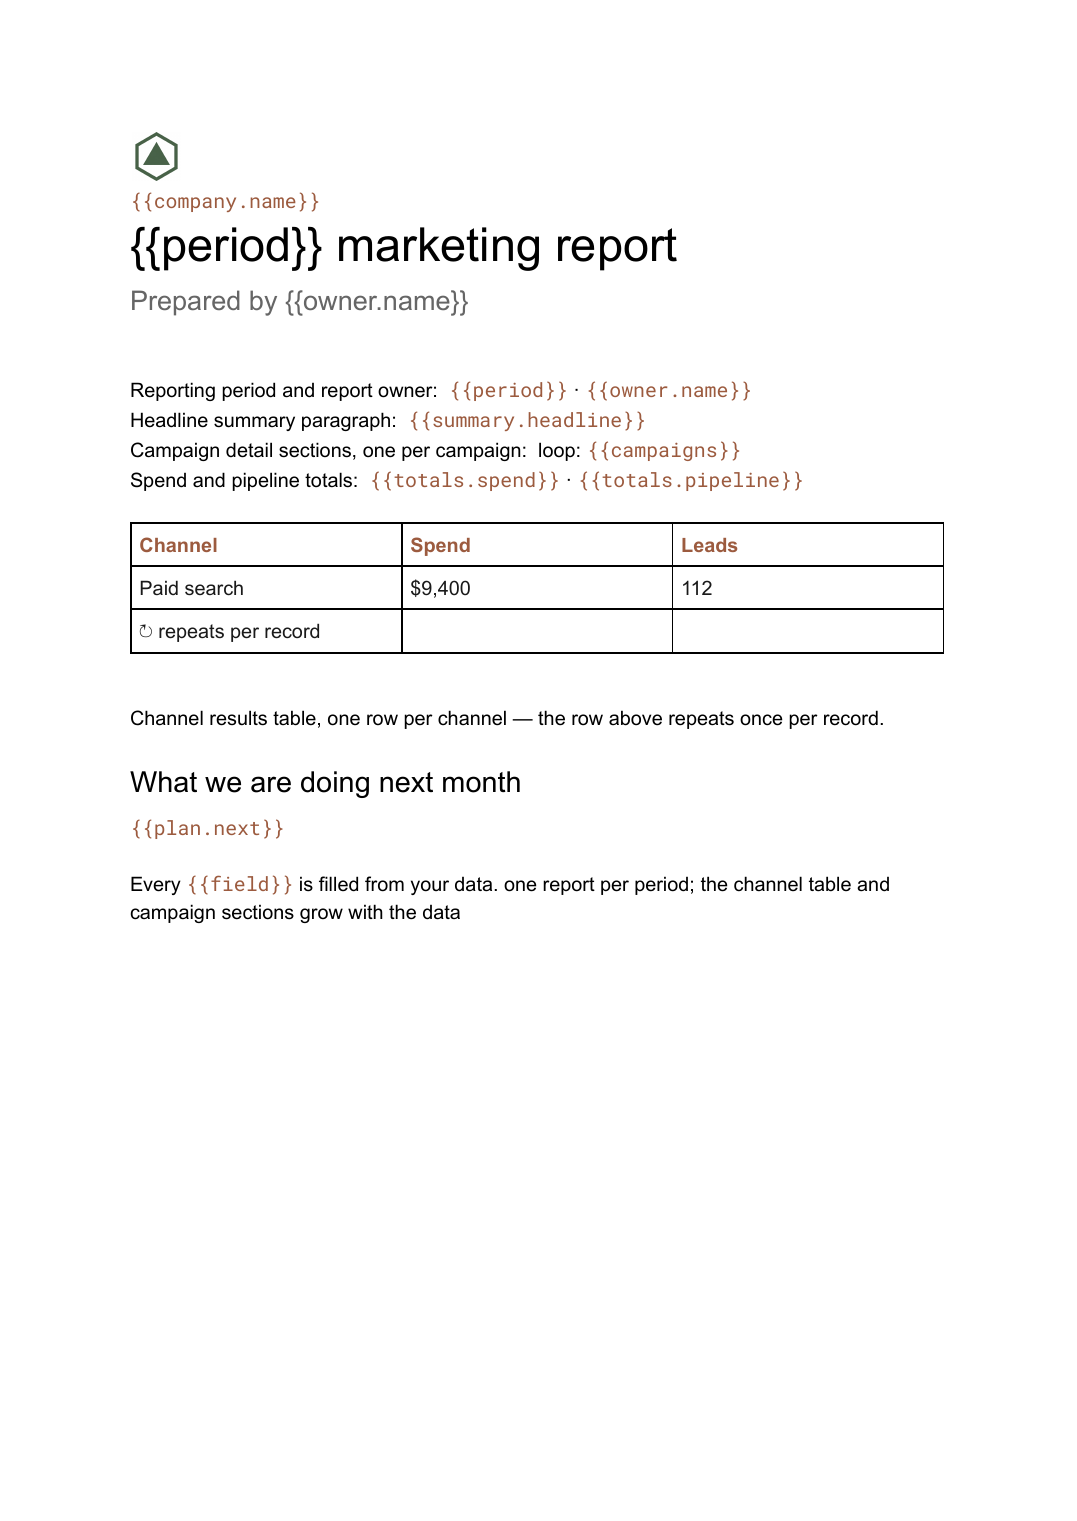 Google Docs
 Monthly marketing report template
A month-by-month marketing performance write-up with channel tables and campaign sections, generated per period from your campaign data.
View template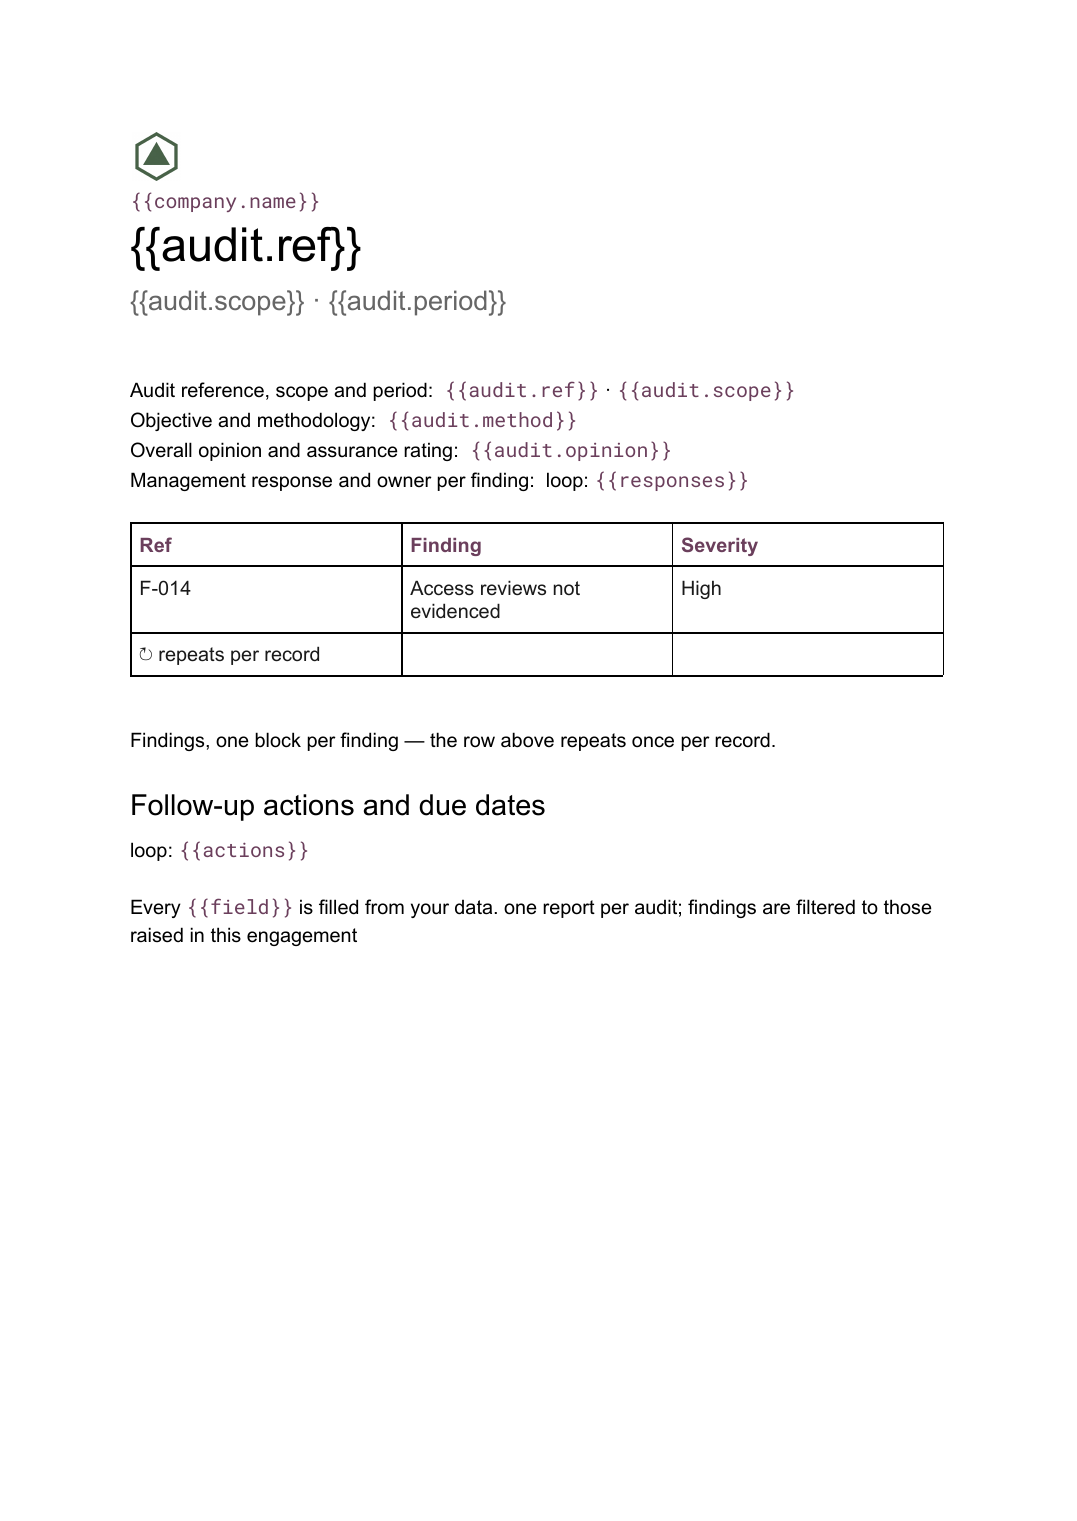 Google Docs
 Audit report template
A per-audit report setting out scope, findings with severity and management responses, generated from your findings register.
View templateCommon questions, answered
Can one report cover several platforms? +
Where does the data come from? +
How do the top posts get chosen? +
Can I use my own design for the report? +
Generate this document from your data
Start on the free plan, connect a data source, and export a real Google Slides document. No watermark, no credit card.